There is nothing more frustrating than a project nearly working as intended, and there is only so much you can print to serial to understand your code.
This is where debugging tools come in to allow you to stop the code executing at specific points, and allow you to inspect the variables, and move through the code line by line if desired.
We can use the GDB debugging system and an external hardware debugger with the Arduino Nano 33 IoT board thanks to its breakouts with a little soldering.
With the Arduino IDE + Visual Micro + Visual Studio software set we have the full IDE experience along with these debugging tools out of the box.
Technical Deep-Dive
- The SWD Protocol (Serial Wire Debug):
- Pins & Communication: Unlike the 20-pin JTAG standard, SWD uses only two pins: SWDIO (Serial Wire Data I/O) and SWCLK (Serial Wire Clock). These are located as tiny surface-mount pads on the underside of the Nano 33 IoT.
- In-Circuit Emulation: SWD allows the external probe to take control of the ARM Core’s program counter, allowing for "Stop-Mode" debugging where the entire SoC freezes, including timers and peripheral states.
- GDB (GNU Debugger) & Segger J-Link:
- The Bridge Logic: The Segger J-Link acts as a translator. It converts the proprietary high-speed debug signals from the chip into a standard TCP/IP or Serial stream that GDB (running on your PC) can understand.
- Breakpoints & Hardware Watchpoints: The SAMD21 has a limited number of Hardware Breakpoints (typically 4-6). These are implemented via the Breakpoint Unit (BPU) in the Cortex-M0+ core. Unlike software breakpoints which modify the machine code, hardware breakpoints monitor the address bus and halt the CPU when a specific memory address is accessed.
- Compiler Optimization Challenges:
- The
-O0Flag: For accurate line-by-line stepping, the code must be compiled with Optimization Level Zero. Standard Arduino compilation (-Os) often "rearranges" code or deletes unused variables to save space, which makes the debugger's cursor jump erratically. vMicro handles this transition automatically when "Debug Mode" is selected.
- The
- USB Driver Abstraction (Zadig):
- Windows often defaults to standard COM port drivers for connected probes. Using the Zadig tool, developers must force a "WinUSB" or "libusb-win32" driver onto the J-Link's Interface 0. This allows low-level software like OpenOCD or Segger GDB Server to bypass the standard OS driver stack for direct hardware access.
The Soldering
Before we can connect our Nano 33 IoT board to our external debugger, we need to connect some female jumper wires onto the pads on the back of the board as below.

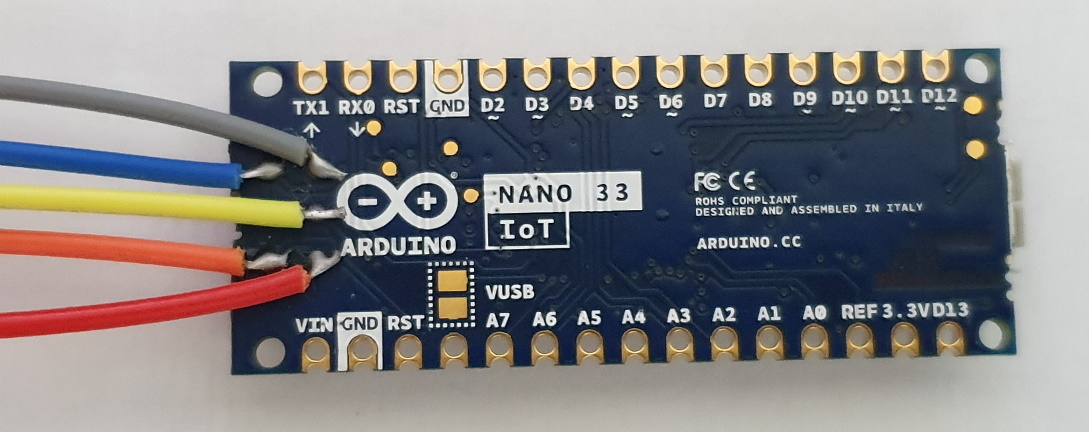
Engineering & Implementation: Precision Soldering for SMDs: Accessing the debug pads requires "Dead-Bug" style soldering. Flux is mandatory here to ensure a clean bridge-free connection between the 30AWG jumper wires and the gold-plated Nano 33 IoT pads. Using female jumpers allows the board to plug directly into the J-Link's 20-pin IDC header.
An External Hardware Debugger
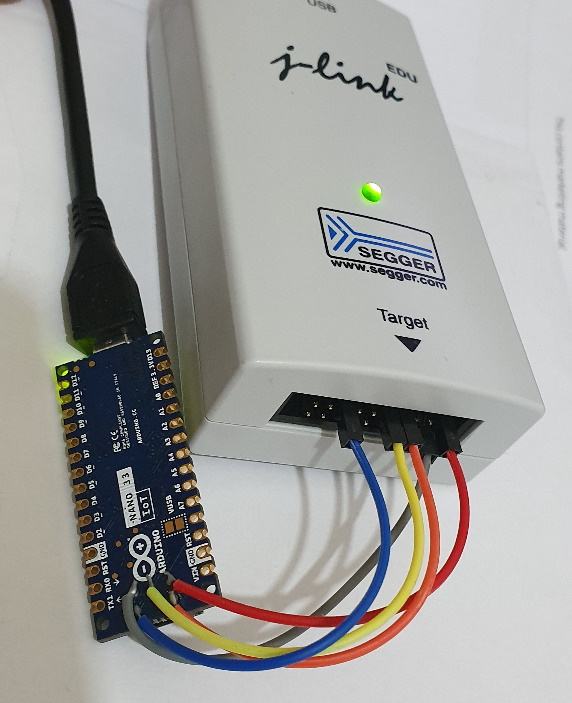
There are a variety of external hardware debugging devices available, and in this example we will be using the Segger J-Link debugger (EDU available for Educational use at a lower cost).
Other debuggers such as the Black Magic Probe are also available, and connect in the same way as shown here, and it is available in Visual Micro already. You can also make your own Probe as shown in our Nano 33 BLE article.
The connections between the two devices are shown below.

Black Magic Probe Alternative: The Black Magic Probe is unique because it hosts the GDB server on the probe itself, eliminating the need for complex driver configurations like OpenOCD on the PC.
Driver Setup
Some debuggers need an additional USB Driver installing on Windows to allow the debugging work correctly.
In our J-Link example you will need the Zadig tool, and to install the driver so they match in the tool.
Open the Zadig tool after downloading
Select Options > List All Devices
Now drop down the device list and select your device (JLink in this case).
If two devices are present select the "Interface 0" of the device
If the driver versions do not match, click Install Driver
There is a handy list of debugger / additional driver information on this page.
Debugging Setup
Once you are setup with the Arduino IDE + Visual Studio + Visual Micro, you can start debugging straight away.
Simply open your project and select the correct board and COM port.
Now you can set the debugger to "Hardware" which will expose a new list of pre-configured debuggers.
Select the one you are using, and ensure the vMicro > Debugger > Optimisation is set to "No Project + Libraries".
Add a breakpoint in where you want to stop initially, these can be moved once you have started the debugger, and there is often a limit of 6 concurrent breakpoints.
Now simply build and upload your code, and attach the debugger. You can also do this in one step by simply pressing Debug > Start Debugging.
Visual Micro Workflow: The Visual Micro extension for Visual Studio provides a "Dashboard" for debugging. It allows for "Break on Exception" logic, which immediately halts the processor if the code attempts to access a null pointer or perform a division by zero.
Real-Time Data Visualization: Beyond stepping, a hardware debugger allows for Variable Watches. You can track the value of an analogRead result or a Wi-Fi signal strength variable in real-time without adding any "debugging overhead" or latency to the production code.
A video of this Debugging Setup section is below:
Solve Those Problems
You should now be stopped on your break point, and a number of other windows are available on the Debug > Windows menu, if you do not see all of the watches / autos, etc.. windows that you wish to use.
Using the stepping and inspection tools, you can now move through the code to find the issues.
Stop guessing and start inspecting: Master your Nano 33 IoT with professional-grade GDB tools.
Useful Links
Getting started with the Arduino NANO 33 IoT
Black Magic Wiki and Hardware Listing / Vendors
Visual Micro - Nano 33 IoT Debugging Overview