This is a very simple project where we will use an ntc thermistor as a temperature captor an Arduino to get the value of resistance of the ntc thermistor and convert it to a valid data of temperature then send it to the computer using serial where we can keep and visualize it. Also we will use an lcd to display the temperature.
Some details
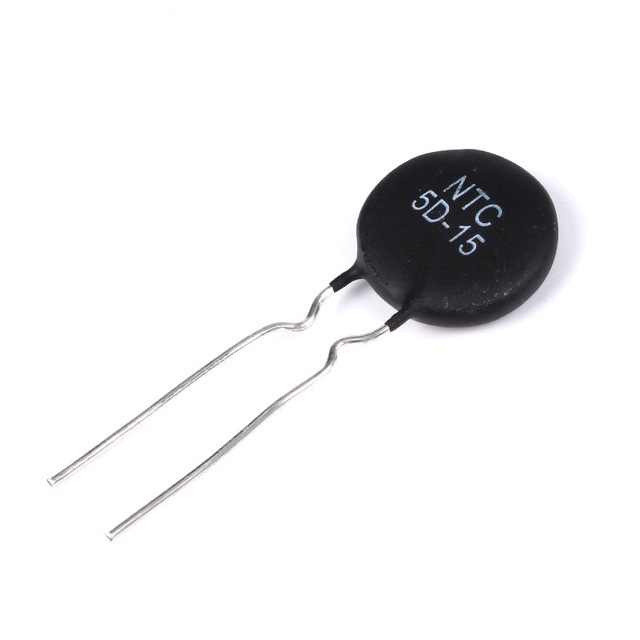
The ntc thermistor is a variable resistor that change it value according to the temperature, ntc stands for negative temperature coefficient which means that the resistance drops with the rise of the temperature and from this given function:

R0 : is the values of the resistance when the temperature equal to T0
B : is a constant of the thermistor that you can find in the datasheet
We will find the expression of thetemperature by the resistance

The temperature here is in kelvins and we will use this function in the arduino code
Now let see how to measure the resistance of the thermistor using Arduino and we will use this circuit
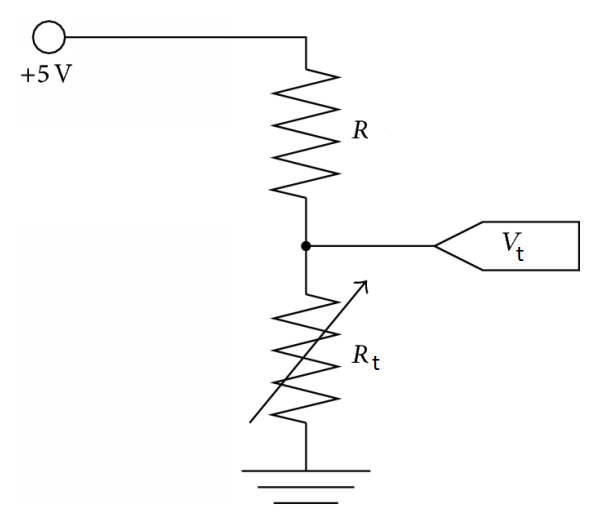
Hooked to the 5v supply from the Arduino while R is a resistor of 110 ohm and the thermistor is Rt and we will measure the voltage Vt in the thermistor using analog input pin A0 and from the formula of voltage divider we will find the expression of the resistence Rt

The circuit:
- LCD RS pin to digital pin 12
- LCD Enable pin to digital pin 11
- LCD D4 pin to digital pin 5
- LCD D5 pin to digital pin 4
- LCD D6 pin to digital pin 3
- LCD D7 pin to digital pin 2
- LCD R/W pin to ground
- LCD VSS pin to ground
- LCD VCC pin to 5V
- LCD K pin to ground
- LCD A pin to 5V
- LCD V0 pin to digital pin 6(pwm)
- LED to pin 13
Put a 110 ohm resistor in series with the thermistor, the side of 110 resitance to 5V, the side of the thermistor to GND and the point where the thermistor and the resistor meet to analog input A0:
EXPANDED TECHNICAL DETAILS
Cross-Platform Telemetry & Dashboard suite
This project establishes a high-speed data link between an Arduino and a PC, using Python 3 to create professional graphical charts of environmental data.
- PySerial Handshake Hub: On the PC side, a Python script opens a serial port and listens for NASA-standard formatted data packets from the Arduino.
- Matplotlib Real-Time Graphing: Uses the Matplotlib library within the Python IDLE environment to render a live-scrolling graph of temperature and humidity data, complete with min/max indicators.
Performance
- Packet-Check Integrity Logic: The Arduino appends a simple checksum to every data string; the Python script verifies this before plotting, ensuring the graph remains stable even if the serial cable is jostled.