When you can't quite figure out what is going on with your project at run time, Debugging Tools can save you a lot of headaches, but you have to find a hardware debugger first....
In embedded systems development, we often encounter unpredictable issues during run-time. Tracing errors using Serial.print() alone may not be sufficient and can be very time-consuming. Debugging tools are therefore a crucial solution to save time and reduce complexity. However, AVR-based boards like the Arduino Uno typically require external hardware debuggers (such as Atmel-ICE), which are expensive and involve messy additional wiring.
GDBStub is a technology that overcomes these limitations. It acts as a small "Software Agent" embedded within the memory of the Arduino Uno (or other AVR boards) to communicate directly with the GDB (GNU Debugger) protocol on a computer via the Serial port. This enables interactive debugging, such as pausing the program (Break), running line by line (Step-through), and inspecting values in Registers or variables, without the need for expensive hardware debuggers.
GDBStub allows us to use the GDB debugging system directly on our Arduino Uno board (or other AVR target), without having to purchase and wire up a Hardware Debugger.
The only downside is it consumes our Serial interface, so we will also connect SoftwareSerial so we can keep our custom Serial print commands, alongside hardware debugging. The only limitation is that GDBStub will take over the Hardware Serial (pins 0 and 1) for debug data communication. Therefore, we must switch to using SoftwareSerial for general Serial data transmission, as we've done before, so that we can still view logs or print values concurrently with debugging.
Hardware Setup
Simply attach the USB lead to your Uno and your PC as normal.
The basic connection still uses the same USB cable from the Arduino Uno to the PC for the debugging process. However, if you want to use the Serial Monitor to display general variable values while debugging, you will need to add a new data path.
If you don't need the additional Serial interface, you can skip the rest of this section.
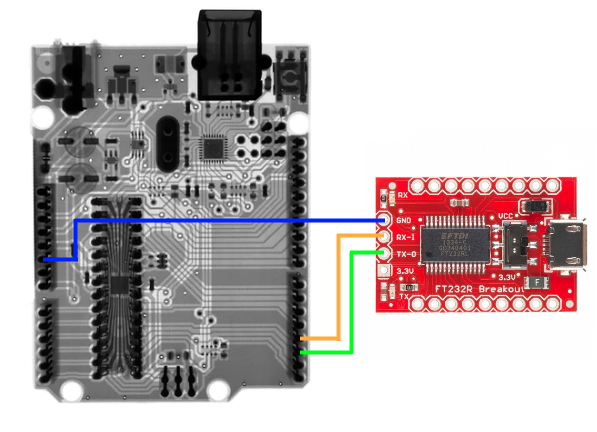
We will use a USB to TTL Serial Breakout module (often using chips like CP2102 or FT232RL) to serve as an alternative communication port. Wire your Uno to your USB TTL Serial breakout board as shown below.
Connect the wires as follows:
- Uno Pin 2 (RX) connects to the TX of the Serial Breakout
- Uno Pin 3 (TX) connects to the RX of the Serial Breakout
- Connect GND of both boards together
(Rx/Tx can be changed in software so allocate to other pins if in use)
Software Setup
Open the project you wish to debug.
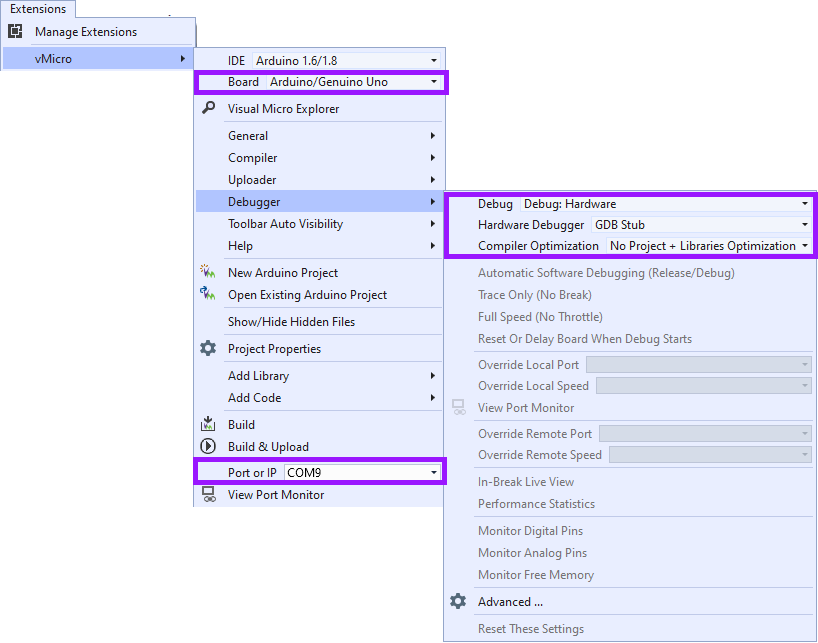
Start by opening the project you wish to debug in Visual Micro (an extension for Visual Studio). Then, configure the settings to inform the IDE that we will be using GDB Stub instead of the regular hardware. Then we can configure our Visual Micro IDE for debugging by selecting the options shown below:-
Installing the GDBStub Library
You can install the GDBStub library manually, or by using the Visual Micro Library Manager:
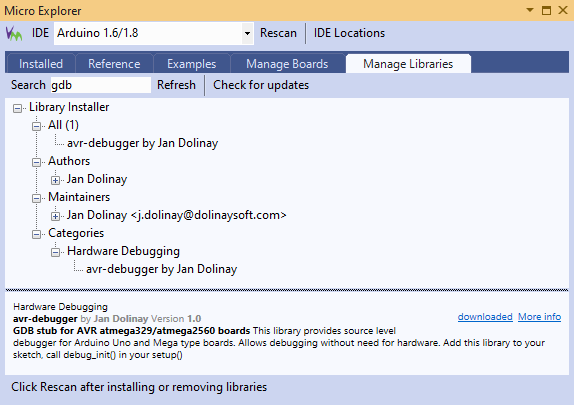
The key to enabling the Arduino Uno to understand GDB commands is the "avr-debugger" library, developed by Jan Dolinay. You can easily install it via the Visual Micro Library Manager:
- Go to the menu vMicro > Add Library > Download and Install Arduino Library > Manage Libraries Tab
- Type "gdb" in the search bar.
- Find the library named "avr-debugger by Jan Dolinay" for the Uno board.
- Click install. Once complete, click the Rescan button at the top, then close the Visual Micro Explorer.
Adding the Code for GDBStub
To harness the GDBStub we will need to add a few lines of code:
To enable the debugging system, we need to add control commands to our Sketch, following three key principles:
- Include Header: Add
#include "avr8-stub.h"at the beginning of the program to import necessary functions and structures for capturing signals from the Debugger. - Initialize: Place the
debug_init()function insetup()to configure the Vector Interrupt and prepare the Serial port for PC connection. - Initial Breakpoint: Adding
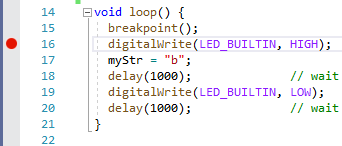
breakpoint()at the first line ofloop()will make the program halt immediately upon startup, allowing us to inspect its state before the main logic runs further.
- Include the avr8-stub.h
- Add debug_init() to your setup() routine
- Add breakpoint() to the top of loop()
Updating the Code for Serial Issues
If you are not using the Serial Breakout then you can just comment out all Serial Code for now (wrap with a #define to make it easy to switch on and off).
Since the main Serial port is reserved for debugging, we should modify the existing code to switch to SoftwareSerial when in debug mode, using Preprocessor Directives like #ifdef _DEBUG.
NOTE - Visual Micro provides _DEBUG automatically if you enable the Project Setting ""Configuration Define _DEBUG" and set its value to 1. When you change to "Release" Configuration this code will deactivate.
Visual Micro will automatically declare _DEBUG if you enable the Project Setting "Configuration Define _DEBUG" as 1, which will cause the debugging-specific code to disappear when you switch to compiling in "Release" mode.
Recommended Practice: To wrap all of your code to be compatible with SoftwareSerial and Serial we suggest you:-
- Include the Software Serial Library from vMicro > Add Library > Current Platform
- Add a #define for the Serial Object in use e.g. USE_SERIAL
- Change all references from Serial to USE_SERIAL
- Add the SoftwareSerial object with the Rx/Tx pins you wish to use
That's all that's needed, and you can switch back to Serial by changing the USE_SERIAL define now.
Setup Additional Serial Monitor
So we can view the additional SoftwareSerial port whilst debugging we will need to make it visible.
To view data from SoftwareSerial while debugging, we need to open a separate Monitor window:
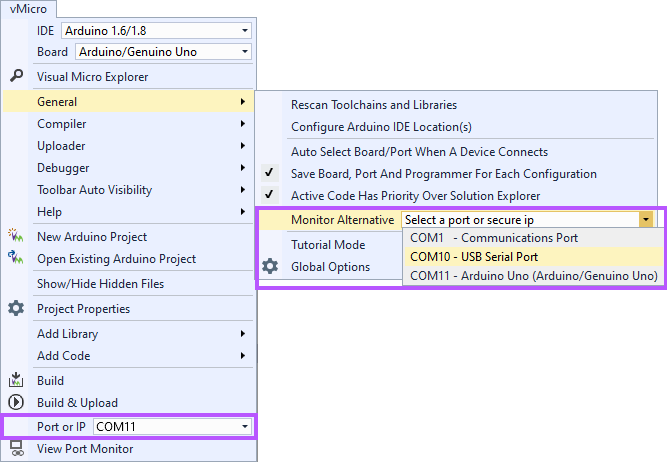
Open vMicro > General > Monitor Alternative, and select the USB Port for your TTL Serial Device, a new Serial Monitor Window should appear connected to this port, without changing your upload port.
Set a Breakpoint
Add a break point to your sketch by clicking in the left hand margin.
You can define points where you want the program to temporarily halt by clicking on the margin next to the line number. GDBStub on AVR boards supports up to 4 breakpoints simultaneously, which is sufficient for tracking down bugs in most functions.
You can add more than one, and up to 4 at any one time.
Start Debugging
Ensure the correct COM port is set for upload.
Ensure the correct COM Port for your Arduino Uno is selected for uploading. Then, you can start debugging in two ways:
To start the debugging process, you can either:
- "Debug > Attach to Process" button if your code has already been uploaded to the board
- "Debug > Start Debugging" if your code has not been uploaded
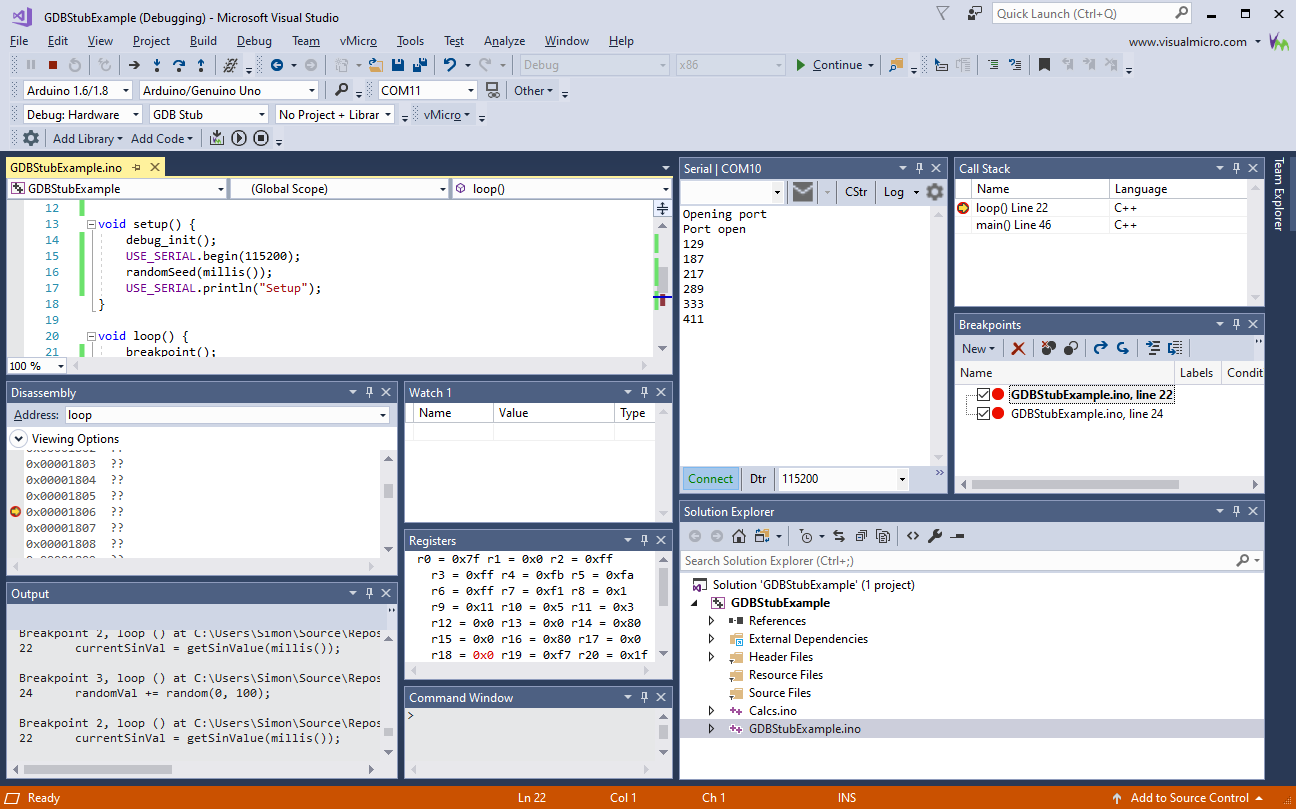
Once in debug mode, you will be able to see variable values change in Real-time and use basic control commands like Step Over and Step Into, just like programming on a regular computer.
Now you can debug in Visual Micro as normal on your Arduino Uno, without an external hardware debugger.
NOTE - you may need to re-open the alternative serial monitor again after debugging begins the first time. After this it will be remembered as part of your Visual Studio Window Layout.
The below Videos go through this process in two steps (1) GDBStub Setup, (2) Software Serial Setup (enable captions on these videos)
The videos below explain the steps in detail, from setting up GDBStub to adapting the code for use with SoftwareSerial: