Step 1: Install Arduino IDE
You probably already have installed the Arduino IDE 2. If not, download and install it from https://arduino.cc.
Check: Start IDE and check the About Arduino entry under the Arduino or Help menu for the version number. It should be 2.3.4 or later.
Step 2: Install new board definition files
Open the Preference dialog of the Arduino IDE and paste the following two Board Manager URLs into the list:
https://felias-fogg.github.io/ATTinyCore/package_drazzy.com_ATTinyCore_plus_Debug_index.json
https://felias-fogg.github.io/MiniCore/package_MCUdude_MiniCore_plus_Debug_index.json
Close the Preference dialog with OK. Now we want to install the two cores ATTinyCore and MiniCore:
- Select
Tools->Board->Board Managers.... This will open theBoards Managerdialog. - In the search field, type first
MiniCoreand install the most recent version (or upgrade to the most recent one) with a+debug-2.Xsuffix. - Afterwards, do the same with
ATTinyCore.
Check: Select Tools -> Board -> ATTinyCore -> Attiny25/45/85 (no bootloader). Then check whether there is an entry Debug Compile Flags: "No Debug" when you click on Tools again. Check that also for Tools -> Board -> MiniCore -> Atmega328.
Step 3: Install dw-link firmware
Download the dw-link firmware into a place inside the Arduino sketchbook. This means, you should
- open the webpage https://github.com/felias-fogg/dw-link,
- click on
Latestin the field Releases - choose either
ziportar.gz, - download and copy the archive to a place in the sketchbook,
- extract the firmware using
unziportar -xvzf.
In order to install the firmware,
- first connect the Arduino UNO to your computer with a USB cable.
- Now open the Arduino IDE and select
Arduino UNOunderToolsas the destinationBoard. - Perhaps, you have to select the right
Portin theToolsmenu as well. - Now load the dw-link sketch into the IDE, which is located at
dw-link-x.y.z/dw-link/dw.link.ino. - Finally, compile and download the sketch to the UNO by either pressing the right arrow button, or by typing
CTRL-Uor⌘U. The UNO acts now a hardware debugger (but needs a bit of additional hardware).
Check: Open the Serial Monitor (under Tools menu), choose 115200 baud, type - (minus sign) into the upper line, and send it. The hardware debugger should respond with $#00.
Step 4: Hardware setup
This description is for debugging an ATtiny85. However, almost any other classic ATtiny or ATmegaX8 would do. Just be aware that when trying to debug an Arduino UNO board, you need to physically alter the board (cut a solder bridge). How to set up an UNO is described in Section 4.5.2 of the dw-link manual.
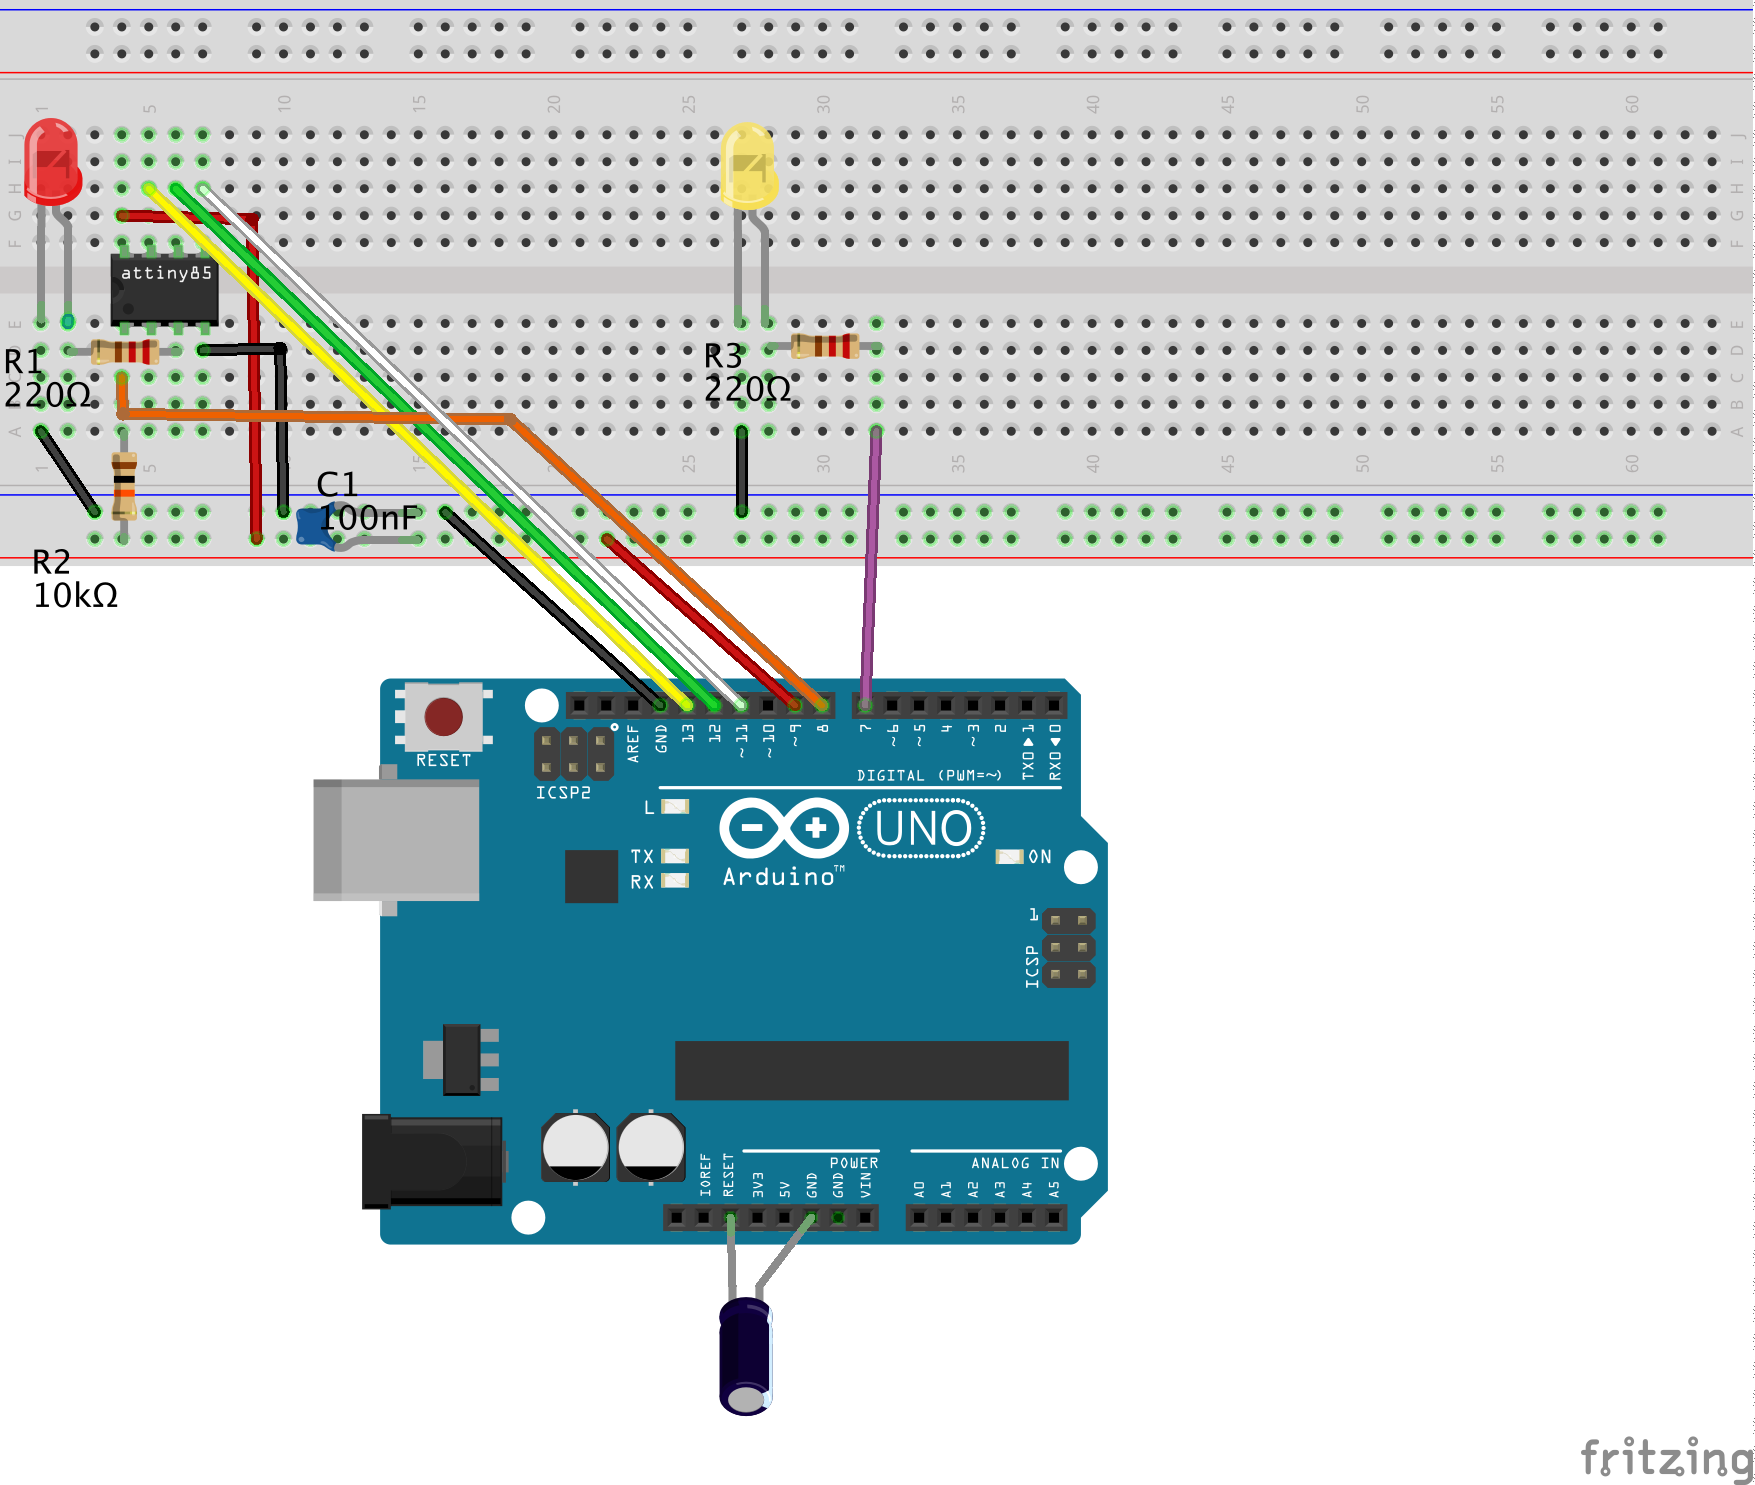
Note that the notch or dot on the ATtiny is oriented towards the left.
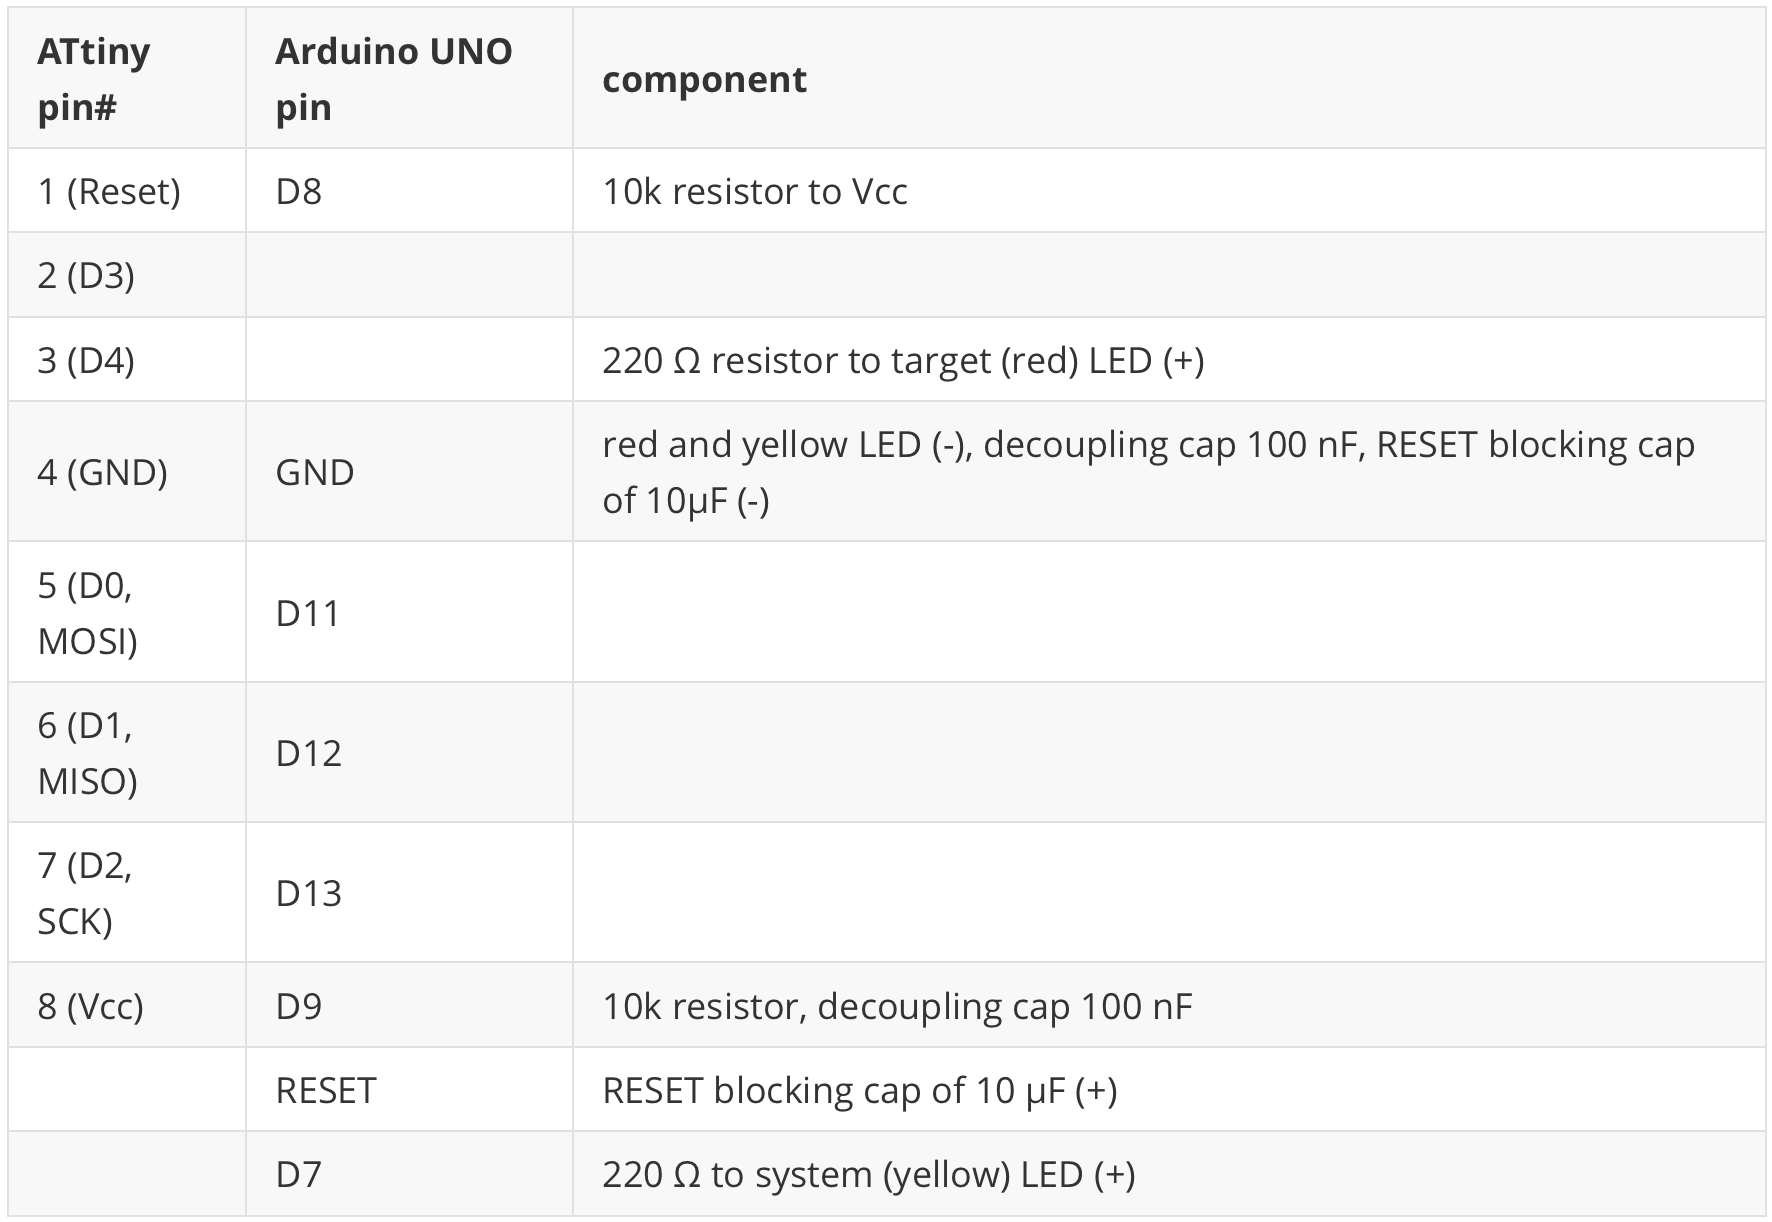
Here is a table of all the connections so that you can check that you have made all the connections.
The (yellow) system LED gives you information about the internal state of the debugger:
- not connected (LED is off),
- waiting for power-cycling the target (LED flashes every second for 0.1 sec),
- target is connected (LED is on),
- ISP programming (LED is blinking slowly),
- error state, i.e., not possible to connect to target or internal error (LED blinks furiously every 0.1 sec).
Note that state 2 (power-cycling) will be skipped in our configuration, where the debugger provides the power supply to the target via a GPIO line and does the power-cycling for you.
Check: Go through the table above and check every connection. Wrong wiring can often cause hours of useless software debugging!
Technical Deep-Dive
- The debugWIRE Protocol (One-Wire Debugging):
- Reset Pin Multiplexing: Unlike the multi-pin JTAG protocol, debugWIRE operates solely over the RESET pin. The
dw-linkfirmware communicates with the target ATtiny by pulling the RESET line HIGH and LOW at specific intervals ($T_{unit}$) to send command packets directly to the internal On-Chip Debug (OCD) system. - Protocol Activation: Enabling debugWIRE requires the permanent disablement of the standard Reset function via a fuse bit change (
DWENfuse). This turns the Reset pin into a high-speed bi-directional data bus.
- Reset Pin Multiplexing: Unlike the multi-pin JTAG protocol, debugWIRE operates solely over the RESET pin. The
- GDB (GNU Debugger) Server Bridge:
- Host-to-Hardware Translation: When you click "Debug" in the Arduino IDE, it launches a GDB Server. This project sets up a "Bridge" that translates the GDB standard commands (e.g.,
step,break,print var) into the raw hex packets understood by the target chip’s debugWIRE port. - Symbolic Debugging: Because the IDE compiles with
-g(debug symbols), you can see your original C++ source code during the debug session rather than raw assembly instructions, dramatically reducing the "Cognitive Gap" during troubleshooting.
- Host-to-Hardware Translation: When you click "Debug" in the Arduino IDE, it launches a GDB Server. This project sets up a "Bridge" that translates the GDB standard commands (e.g.,
- Optimization for Debugging (
-Og):- Standard compilation optimizes code for "Size" or "Speed," which often rearranges instructions and makes line-by-line debugging impossible. This guide teaches the user to select the "Optimize for Debugging" flag, which preserves the correspondence between source code lines and machine instructions.
- Status LED State Machine:
- The Yellow System LED provides real-time diagnostic telemetry. It uses a specific blink pattern to differentiate between "Waiting for Target" (where the debugger provides power-cycling logic) and "Error State" (indicating a bus collision or signal integrity issue on the Reset line).
Engineering & Operation
- Capacitive Reset Mitigation: A critical engineering step involves placing a 10µF capacitor between the Reset and GND pins of the Debugger Arduino. This prevents the UNO from resetting itself when the GDB server opens the serial port, ensuring the connection to the target chip remains persistent.
- Target Power-Cycling: The
dw-linkfirmware can intelligently control the power to the target chip via a digital GPIO. This allows the debugger to perform an "Automated Power-Cycle," a requirement for entering debugWIRE mode on certain silicon revisions of the ATtiny series. - Safety & Reset Restoration: A common pitfall in hardware debugging is "Locking" the chip in debug mode. The documentation explains how to perform a Clean Exit, which sends the specialized
quitcommand to restore the Reset fuse—a vital step if you ever plan to return the chip to standard ISP programming. - Professional Toolchain Integration: By installing the custom ATTinyCore and MiniCore definitions, developers gain access to промышленный-уровень (industrial-grade) cores that have been specifically patched to support the
dw-linkback-end, creating a seamless workflow from first-code-line to hardware-freeze.
Stop guessing and start seeing: Unlock the internal state of your AVR silicon with hardware-level precision.
Step 5: Debugging
Now, we are ready to debug the sketch on the target chip. Check that the host, the computer you are sitting at, is connected to the hardware debugger, the UNO, with a USB cable. The hardware debugger should in turn be connected to the target chip, the ATtiny85, by 6 flying wires as we have prepared it in step 4.
- Load the sketch you want to debug into the IDE by choosing
Open...in theFilemenu. - Select
ATtiny25/45/85 (no bootloader)as the board underTools -> Board -> ATTinyCore. - In the
Toolsmenu, choose1 MHz (internal)as theClock Source(assuming that the ATtiny is as it comes from the factory and no fuse has been changed). - In the
Sketchmenu, selectOptimize for Debugging. - Compile the code by clicking the
Verifybutton in the upper-left corner. - Open the debug panes by clicking the debug symbol (bug with the triangle) in the left sidebar.
- Click the debug symbol in the top row to start debugging. This will start the debugger and the debug server. The activities are logged in the
Debug Consoleand thegdb-server consolein the bottom right part of the window. - After the debugger and debug-server have been started, the debugger will start executing the program on the target. Execution will stop at the first line of the
setupfunction. - Now, you are in business and can set breakpoints, continue executing, stop the program asynchronously, inspect and change values, and examine different stack frames. To terminate your debugging session, click the red box in the debug row. Check out the debugging tutorial on the Arduino website
What can go wrong?
First, you might be unable to start debugging because the debug button is greyed out. This happens for all MCUs that the IDE cannot debug. If you think that this is an error, you might need to install the correct board definition files or choose the Reload Board Data entry in the Tools menu.
Second, the debug-server might terminate early. In this case, you should see an error message in the gdb-server console.
If something does not work as advertised, it is very often a simple wiring problem. The next possible sources of errors are installation errors, i.e., that a program is not installed at the right place, does not have the right permissions, the PATH variable is not right, or one has installed the wrong board manager files. When some strange error messages show up, it may also be an indication that some component has not been installed. Google for the error message! Often there are hints how to mitigate the problem. Finally, there is also a troubleshooting section in the dw-link manual, which may be helpful.
The most annoying problem is that after a debugging session, an MCU might not be responsive anymore. The reason can be that the RESET line, which during debugging is used as a communication line, has not been reenabled. While a regular exit of the debugger restores the RESET line, it can happen that the debugger is terminated without restoring the RESET line. An easy cure is to enter the debugger again and leave it regularly (after connecting to the target chip) with the command quit.
If you think that you have found a bug, please consider posting it on issues and consider filling out the issue form before.
After debugging has finished
So what do you do with your newly built hardware debugger after everything has been debugged? You don't have to throw it away. It is also an ISP programmer (STK500 v1). In the Arduino IDE, such a programmer is called AVR ISP or Arduino as ISP.
You may also consider to give the hardware debugger a more durable shape. This is all covered in the dw-link manual.
Acknowledgements
I put a lot of effort in building dw-link, but it is not all my own doing. I made heavy use of other people's open source software, ideas, and publications. Many thanks to them for sharing their ideas:
- RiskusW's reverse engineering of debugWIRE,
- Jon Dolany's avr_gdb project that provides a gdb-stub for ATmega328 and other ATmegas,
- David C W Brown's debgWIRE debugger dwire-debug,
- Wayne Holder's DebugWireDebuggerProgrammer, and
- ccrause's debugwire-gdb-bridge.