The story
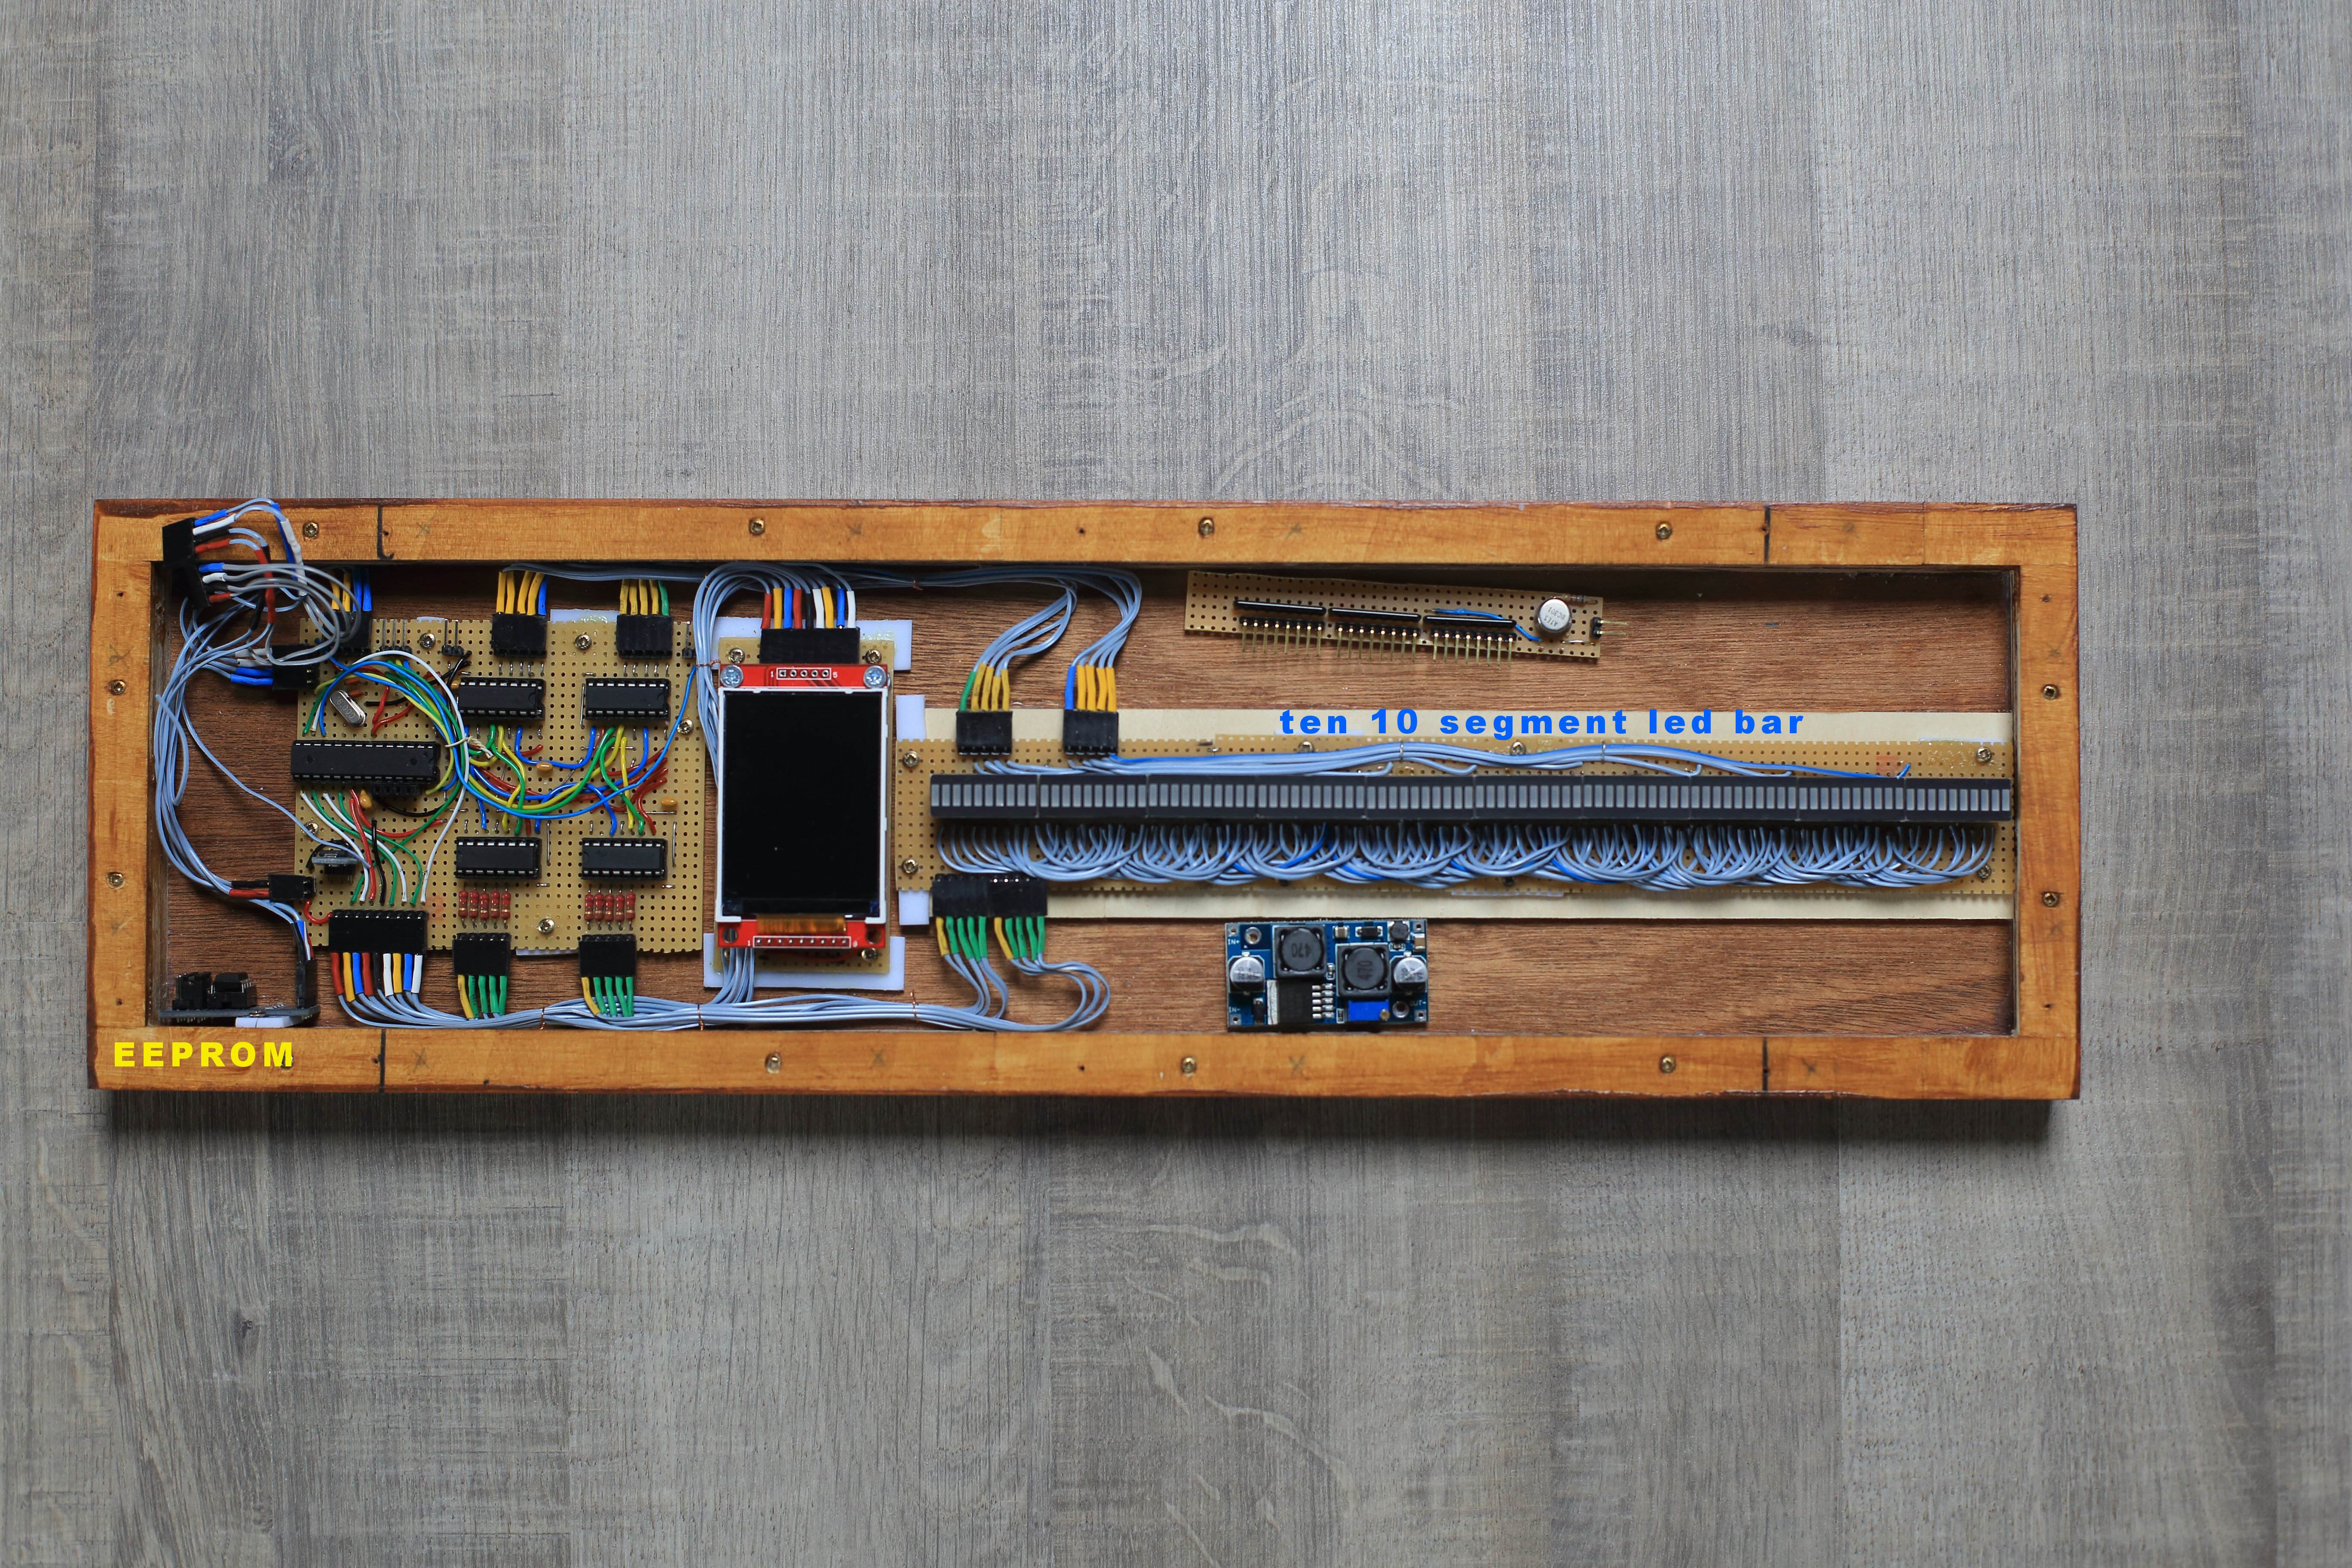
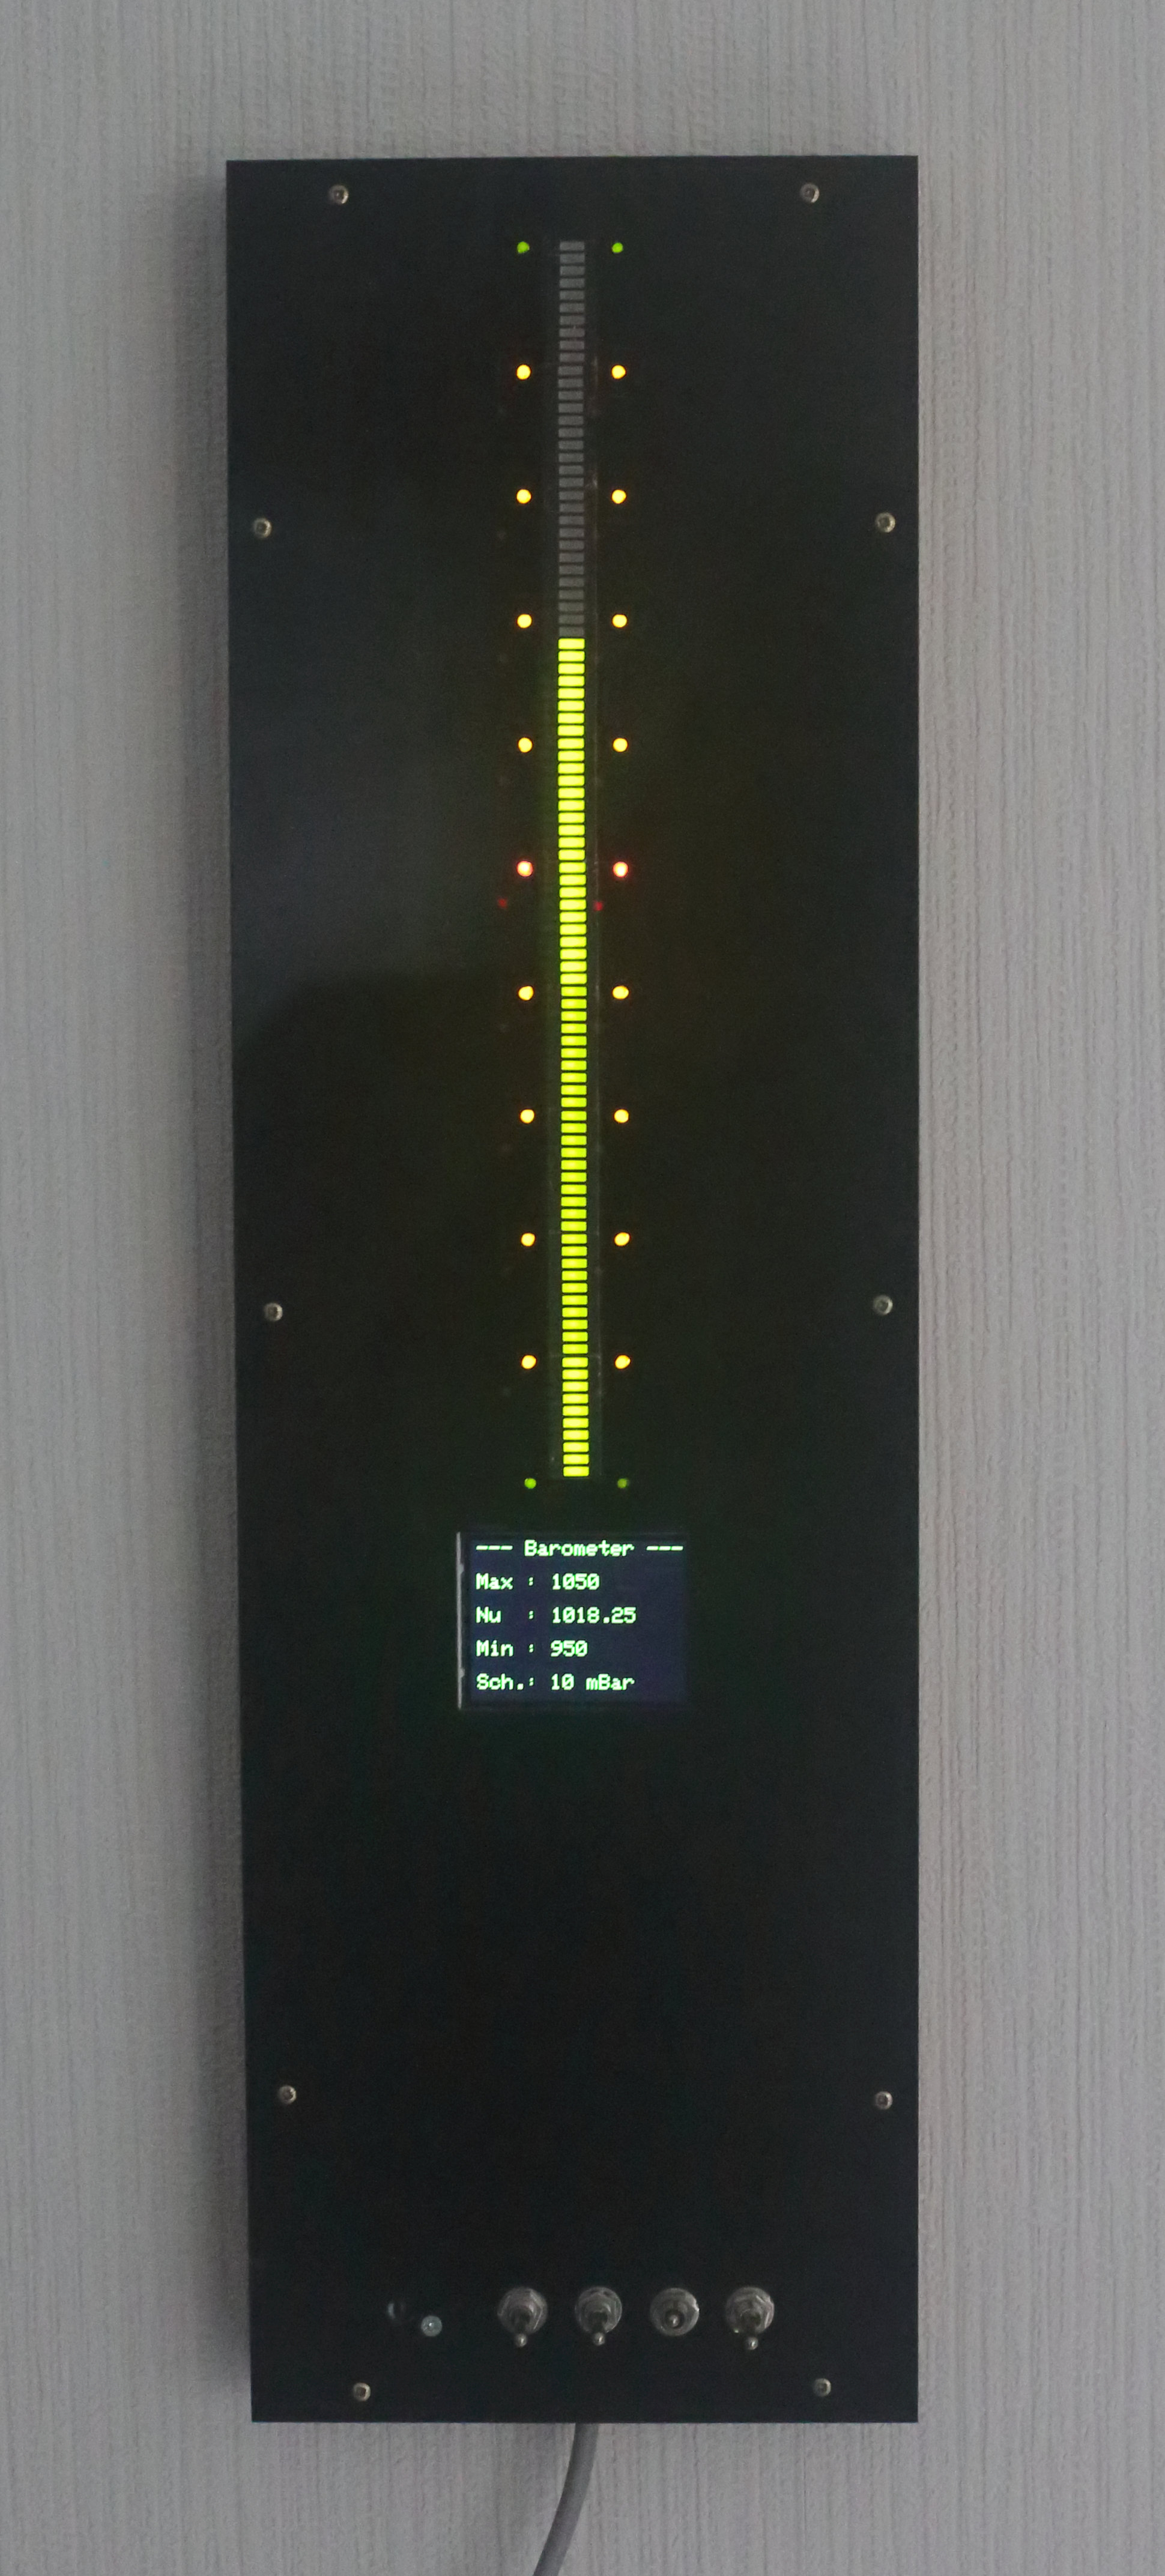
I wanted to make a barometer with high resolution scale. So I used ten 10-led bar arrays, a total of 100 leds. The full scale is from 950 - 1050 mBar.
I also included temperature and humidity.
And there are 22 leds (2x11) to indicate the scale.
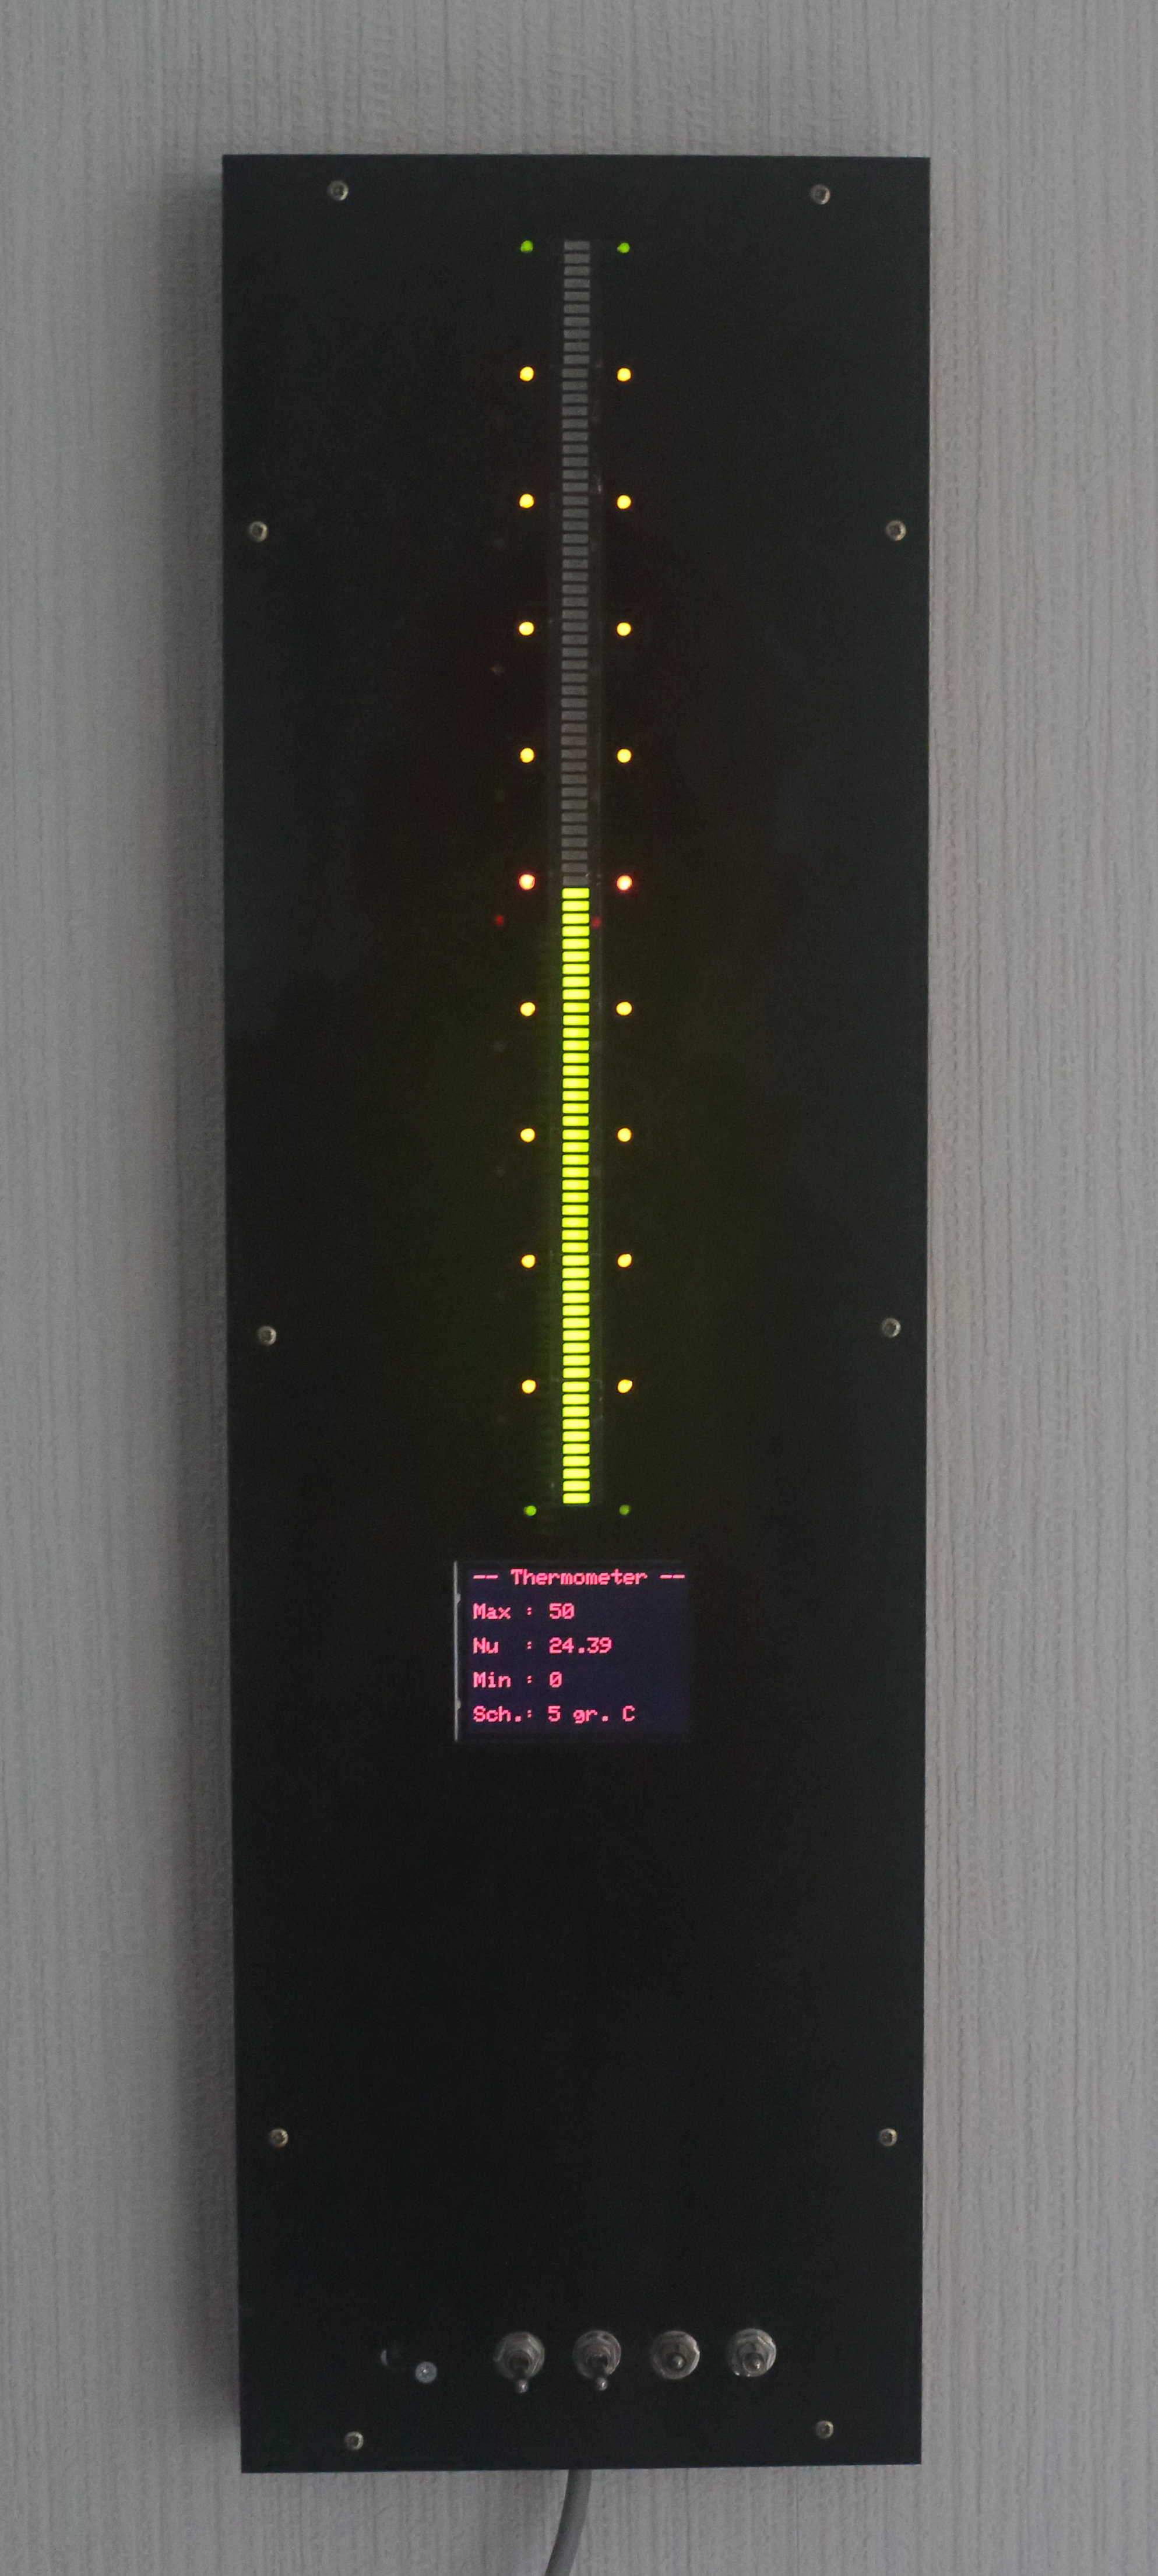
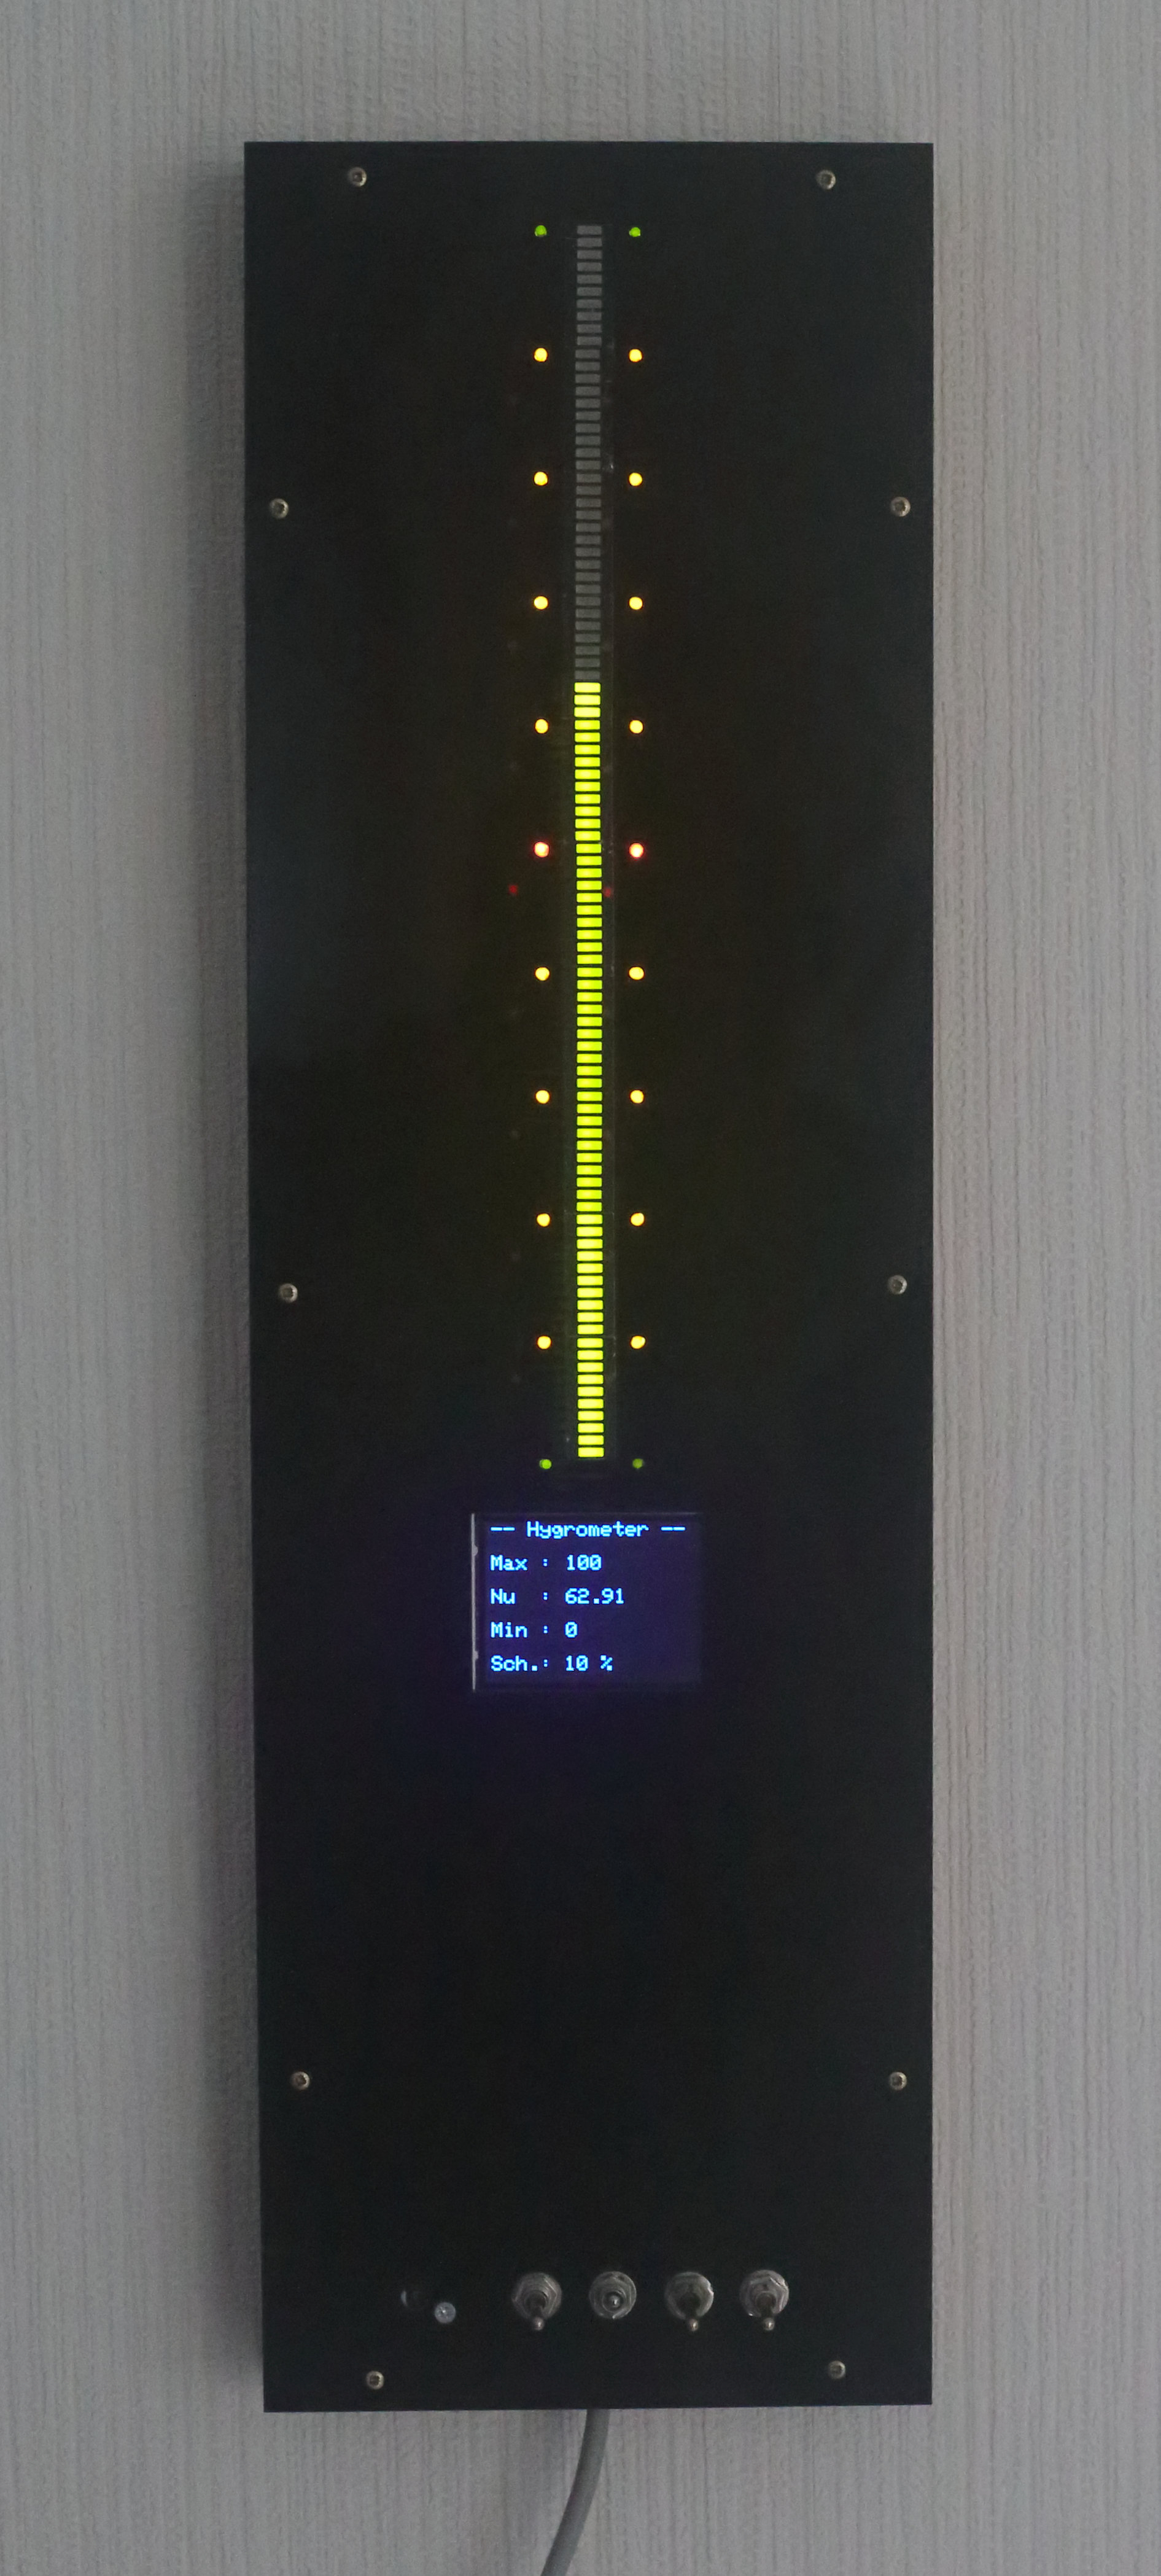
The temperature range is from 0 - 50 degrees celsius, and humidity range is from 0 - 100 % relative humidity.(hygrometer)
I also included a colour TFT display ILI9341 (320x200 pixels) to display the scale and measured value of the sensor. I am using a BMP280 for the pressure and a SHT31 for the temperature and humidity. To control the 100 leds I am using 4 shiftregisters SN74595.
The air pressure on the display is green, the temperature is red and the humidity is blue.
And I am using an extra memory (EEPROM) of 32kByte to store the readings of the sensors. The program is reading every 30 seconds the sensors and every 15 minutes the data is stored into the EEPROM, so there are 96 data points in 24 hours. The data is shifted in, only 24 hours of data is stored. So you can see the trend of the barometer, thermometer or hygrometer of the past 24 hours.
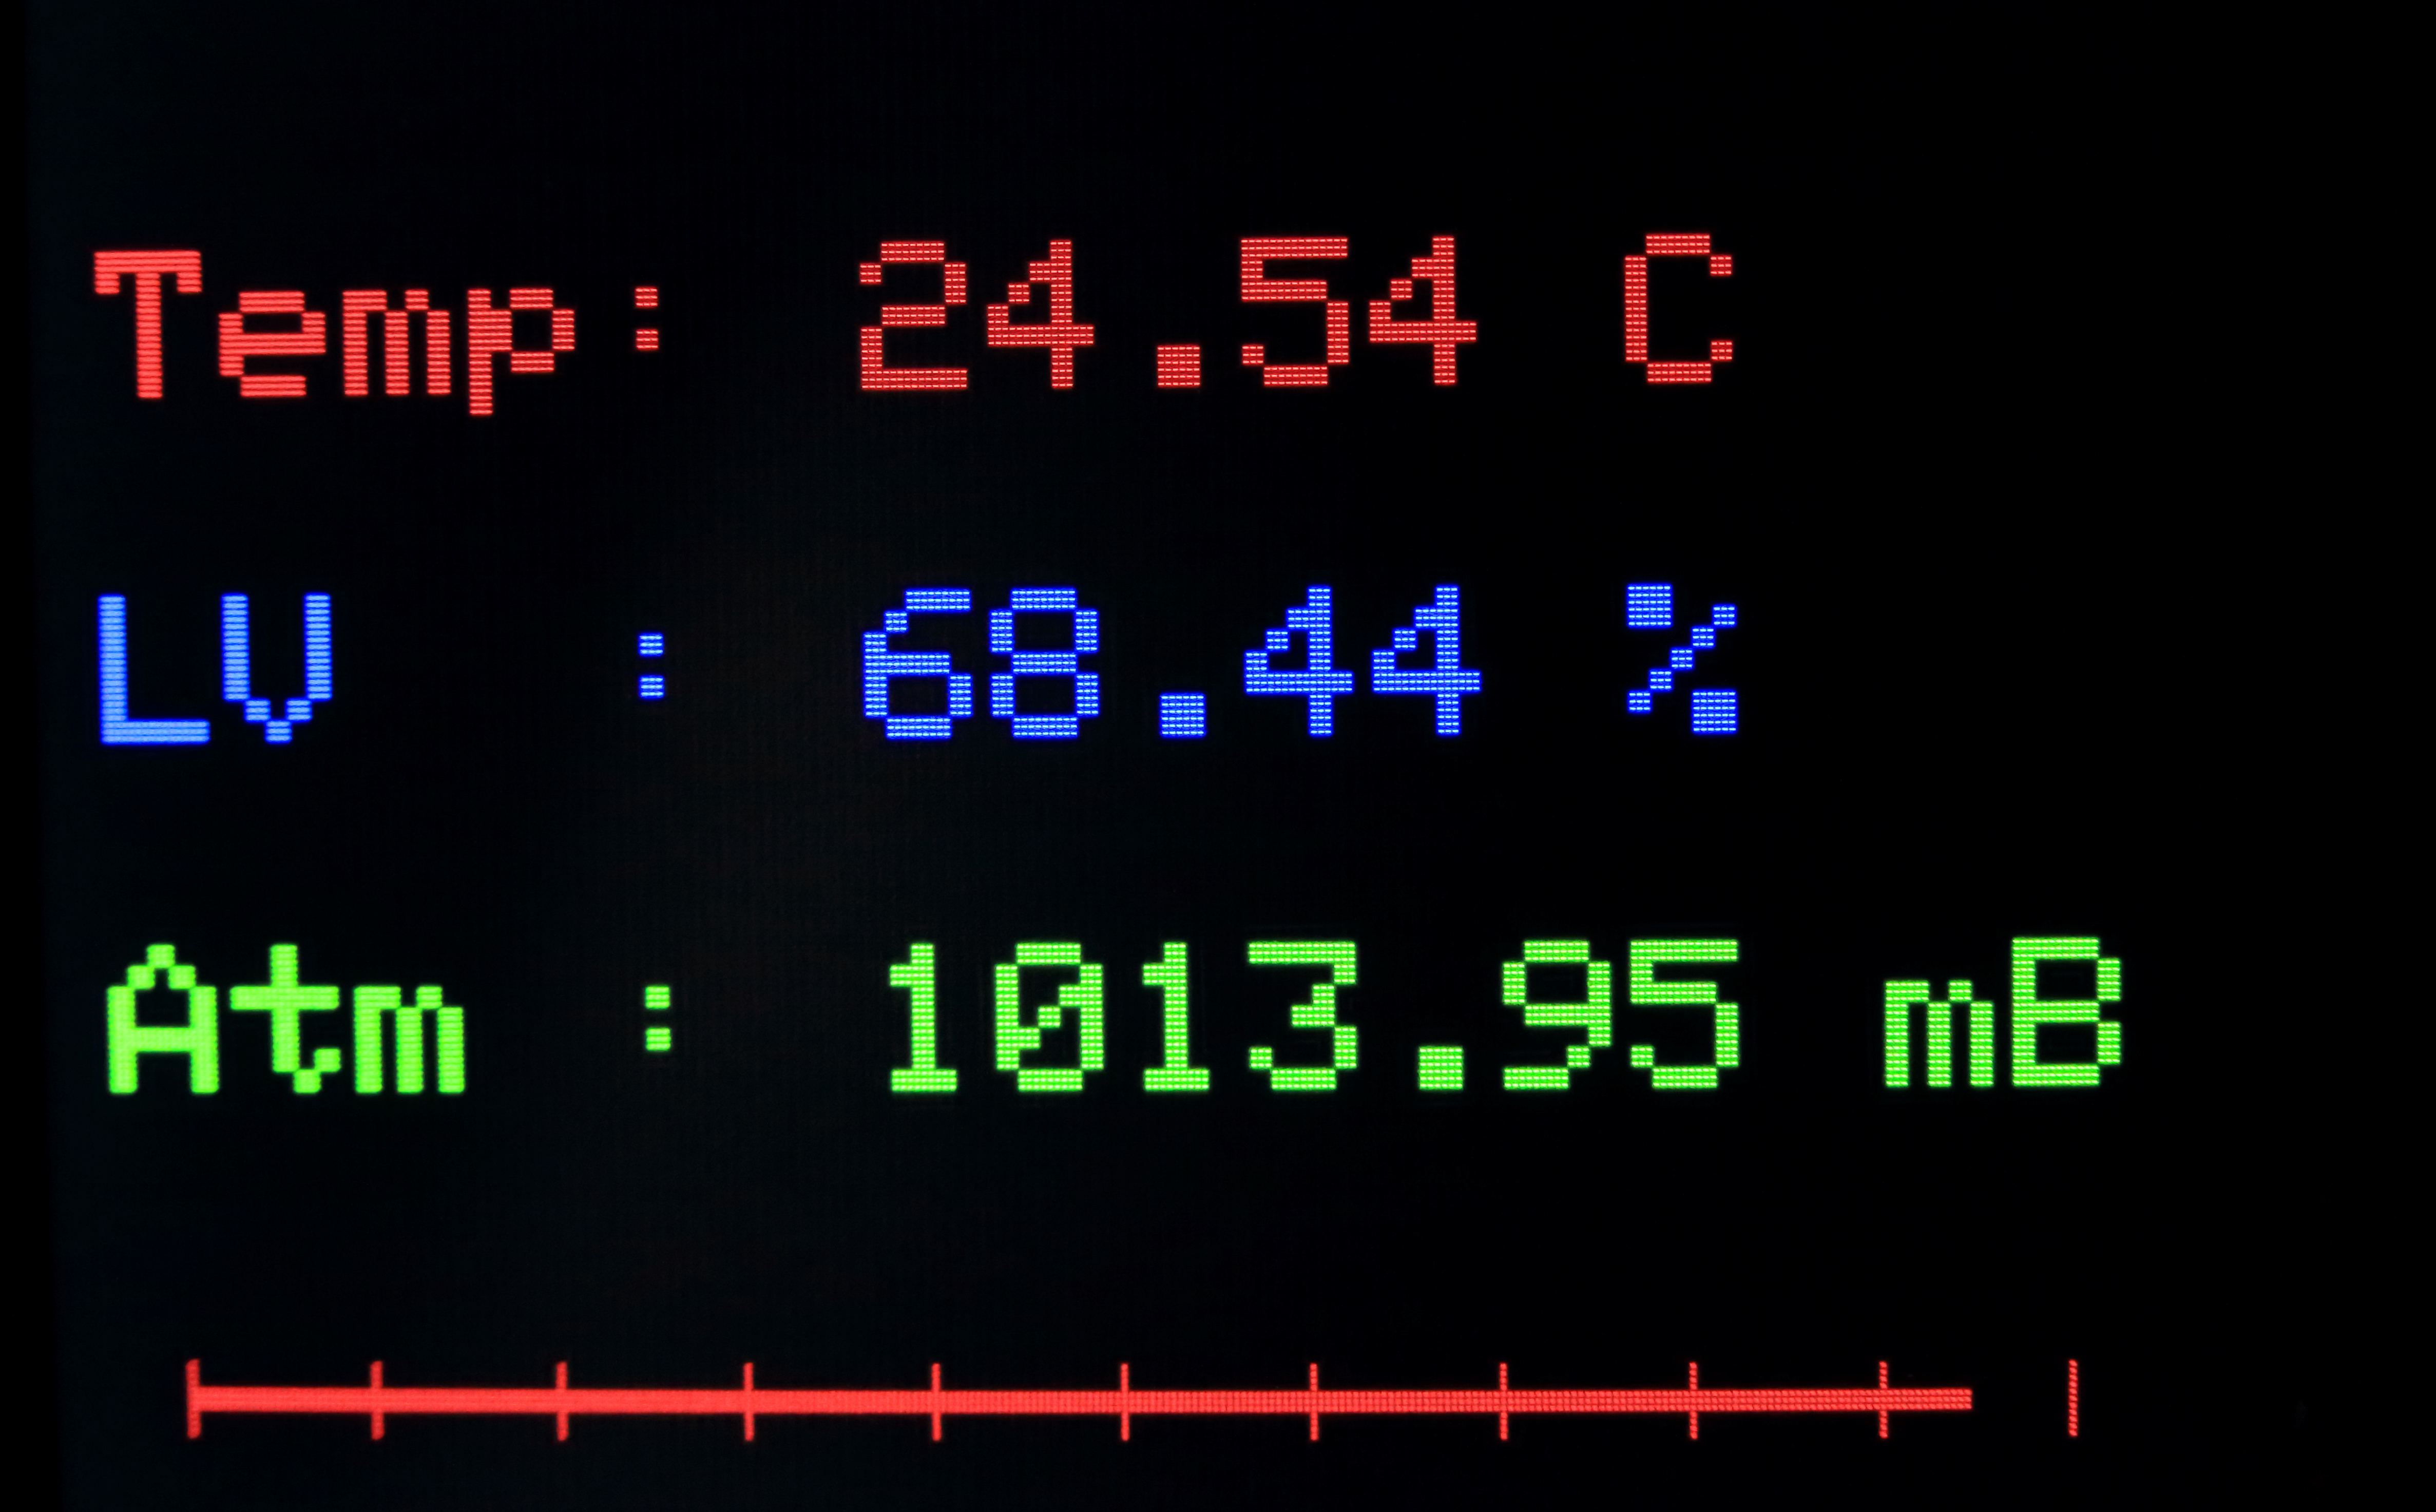
On the photo above (close up overview) : Temp = temperature, LV = humidity (Dutch Lucht Vochtigheid) and Atm = air pressure (Atm = atmosphere)
The program is checking the state of four switches. With four switches there are 16 functions. The functions are:
Function 0000:
Display and led bar are blank.
Function 0001:
Led bar: blank
Display: values of the sensors (see photo above : close up overview)
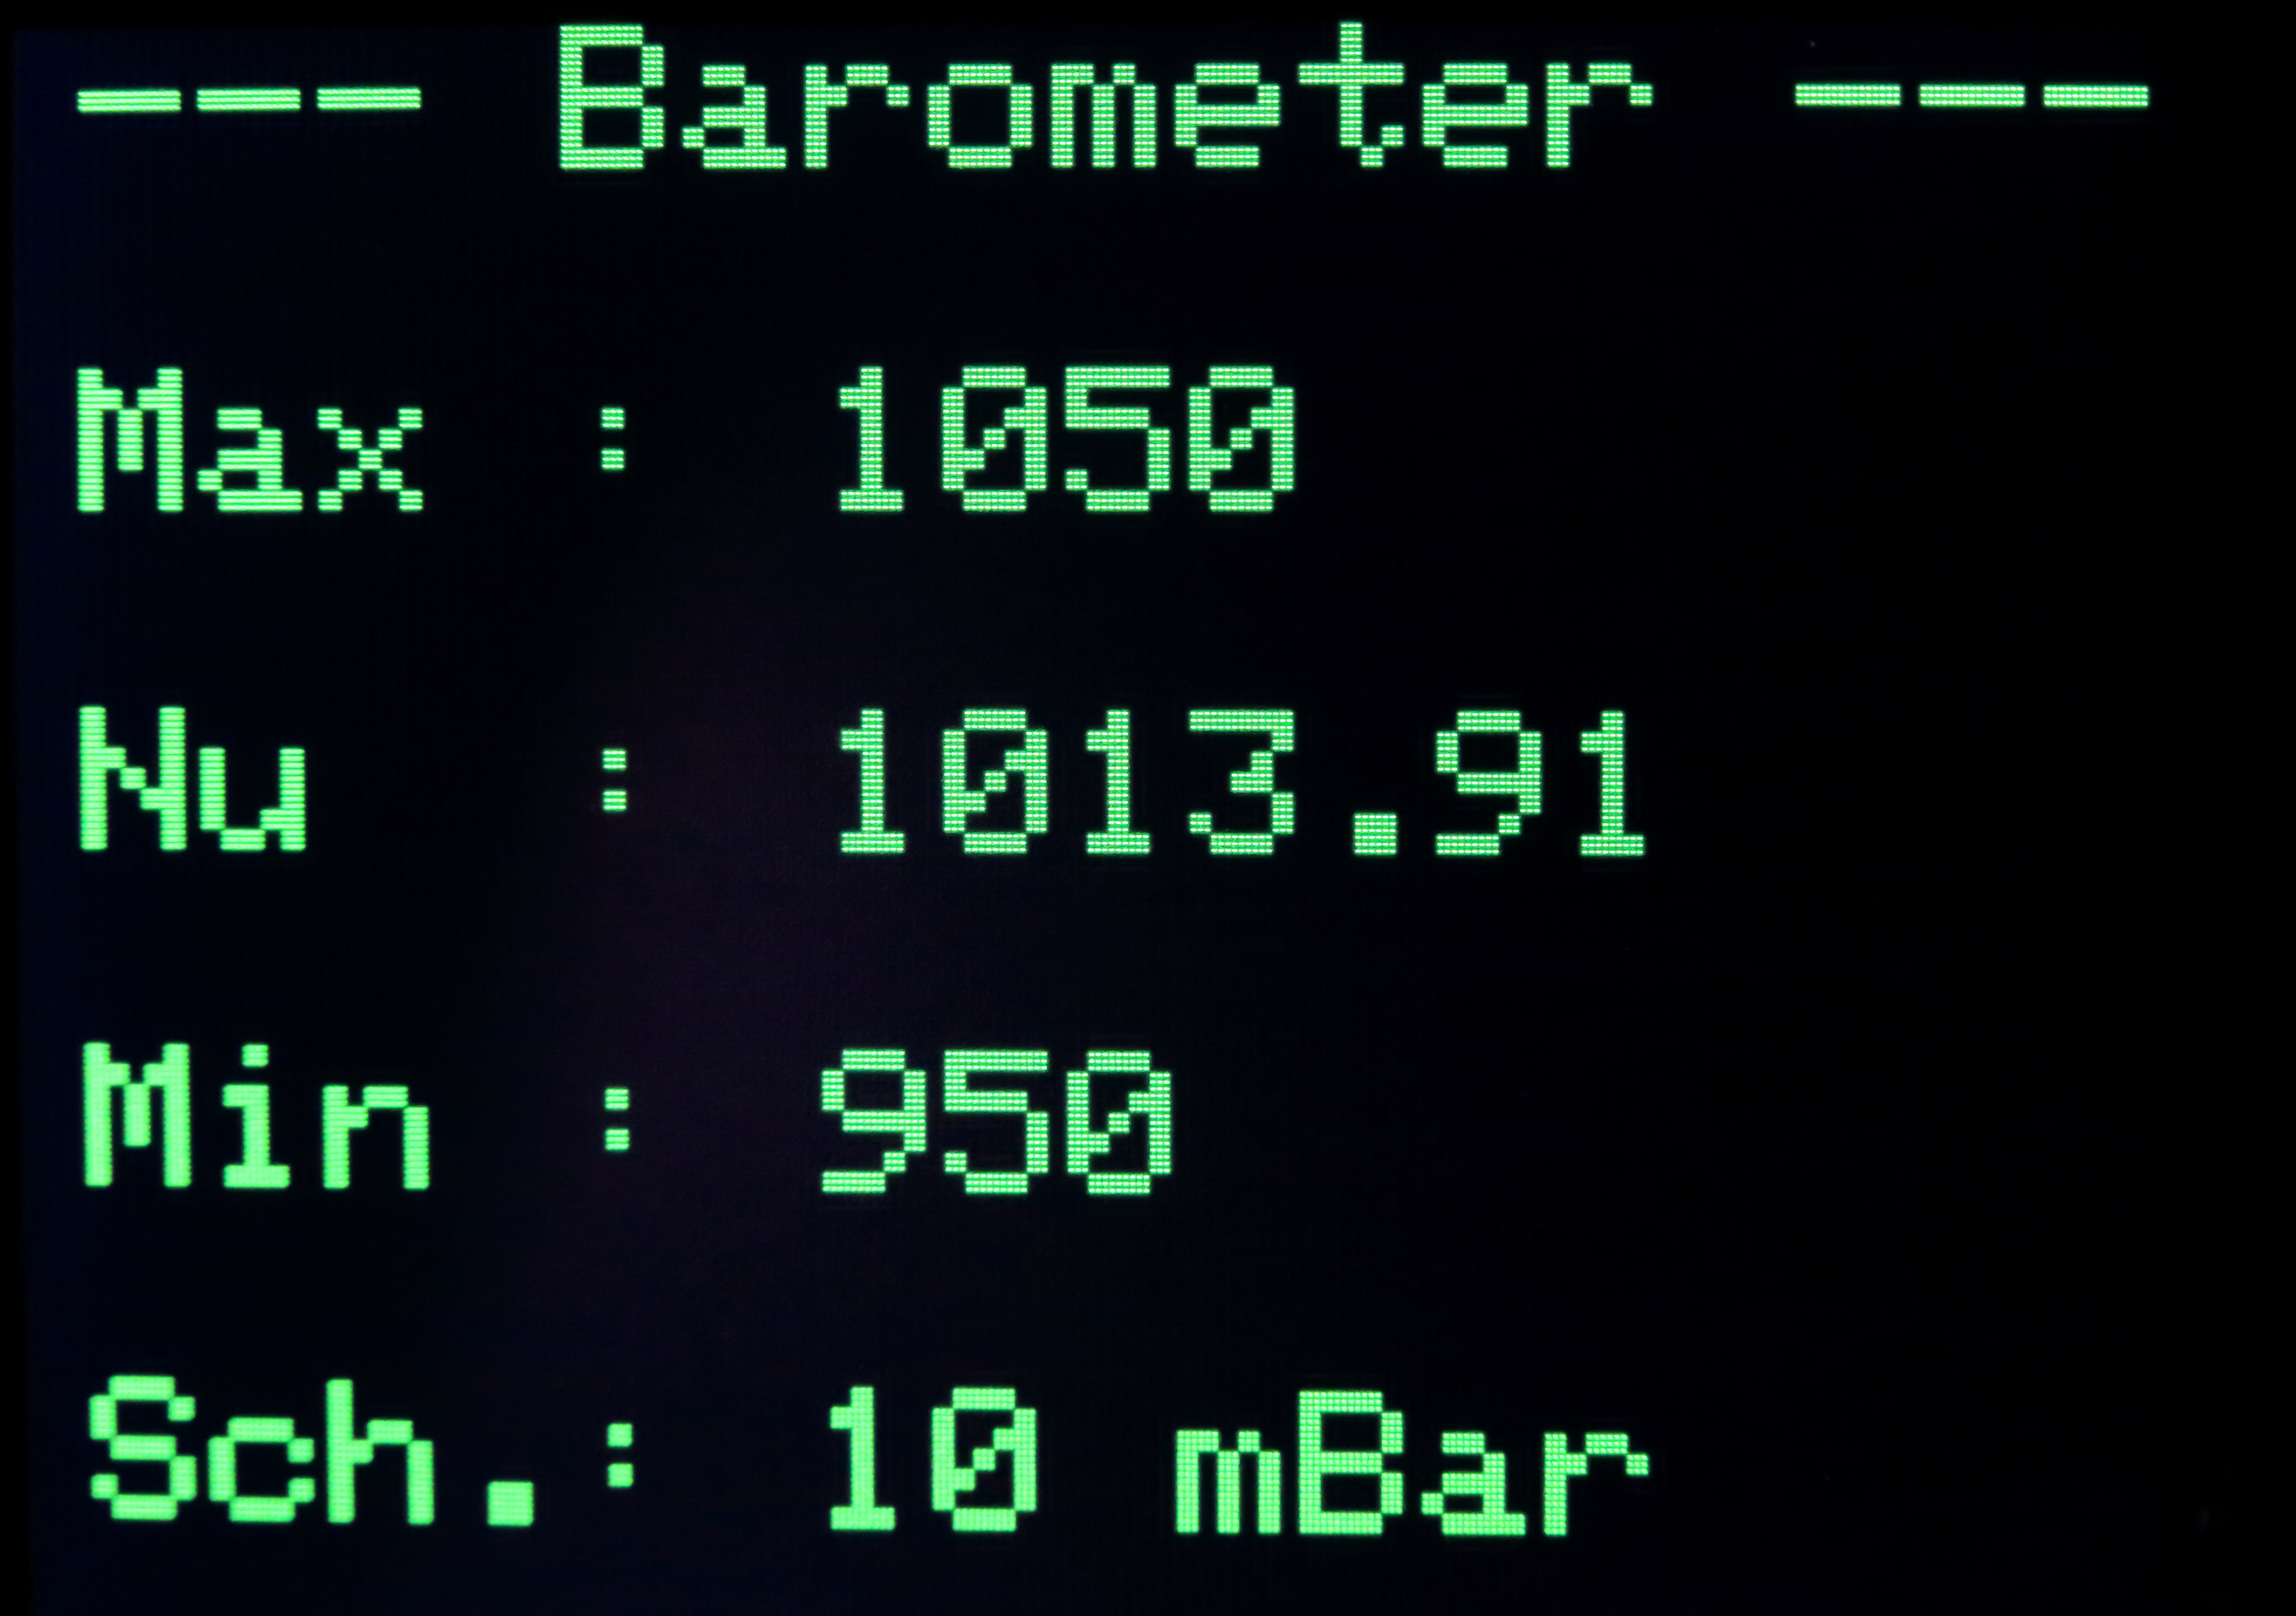
Function 0010: Air pressure
Led bar: indication of the air pressure in mBar
Display: Range is from 950 - 1050 mBar,
Actual air pressure
Scale = 10 mBar ( 1 led = 1 mBar)
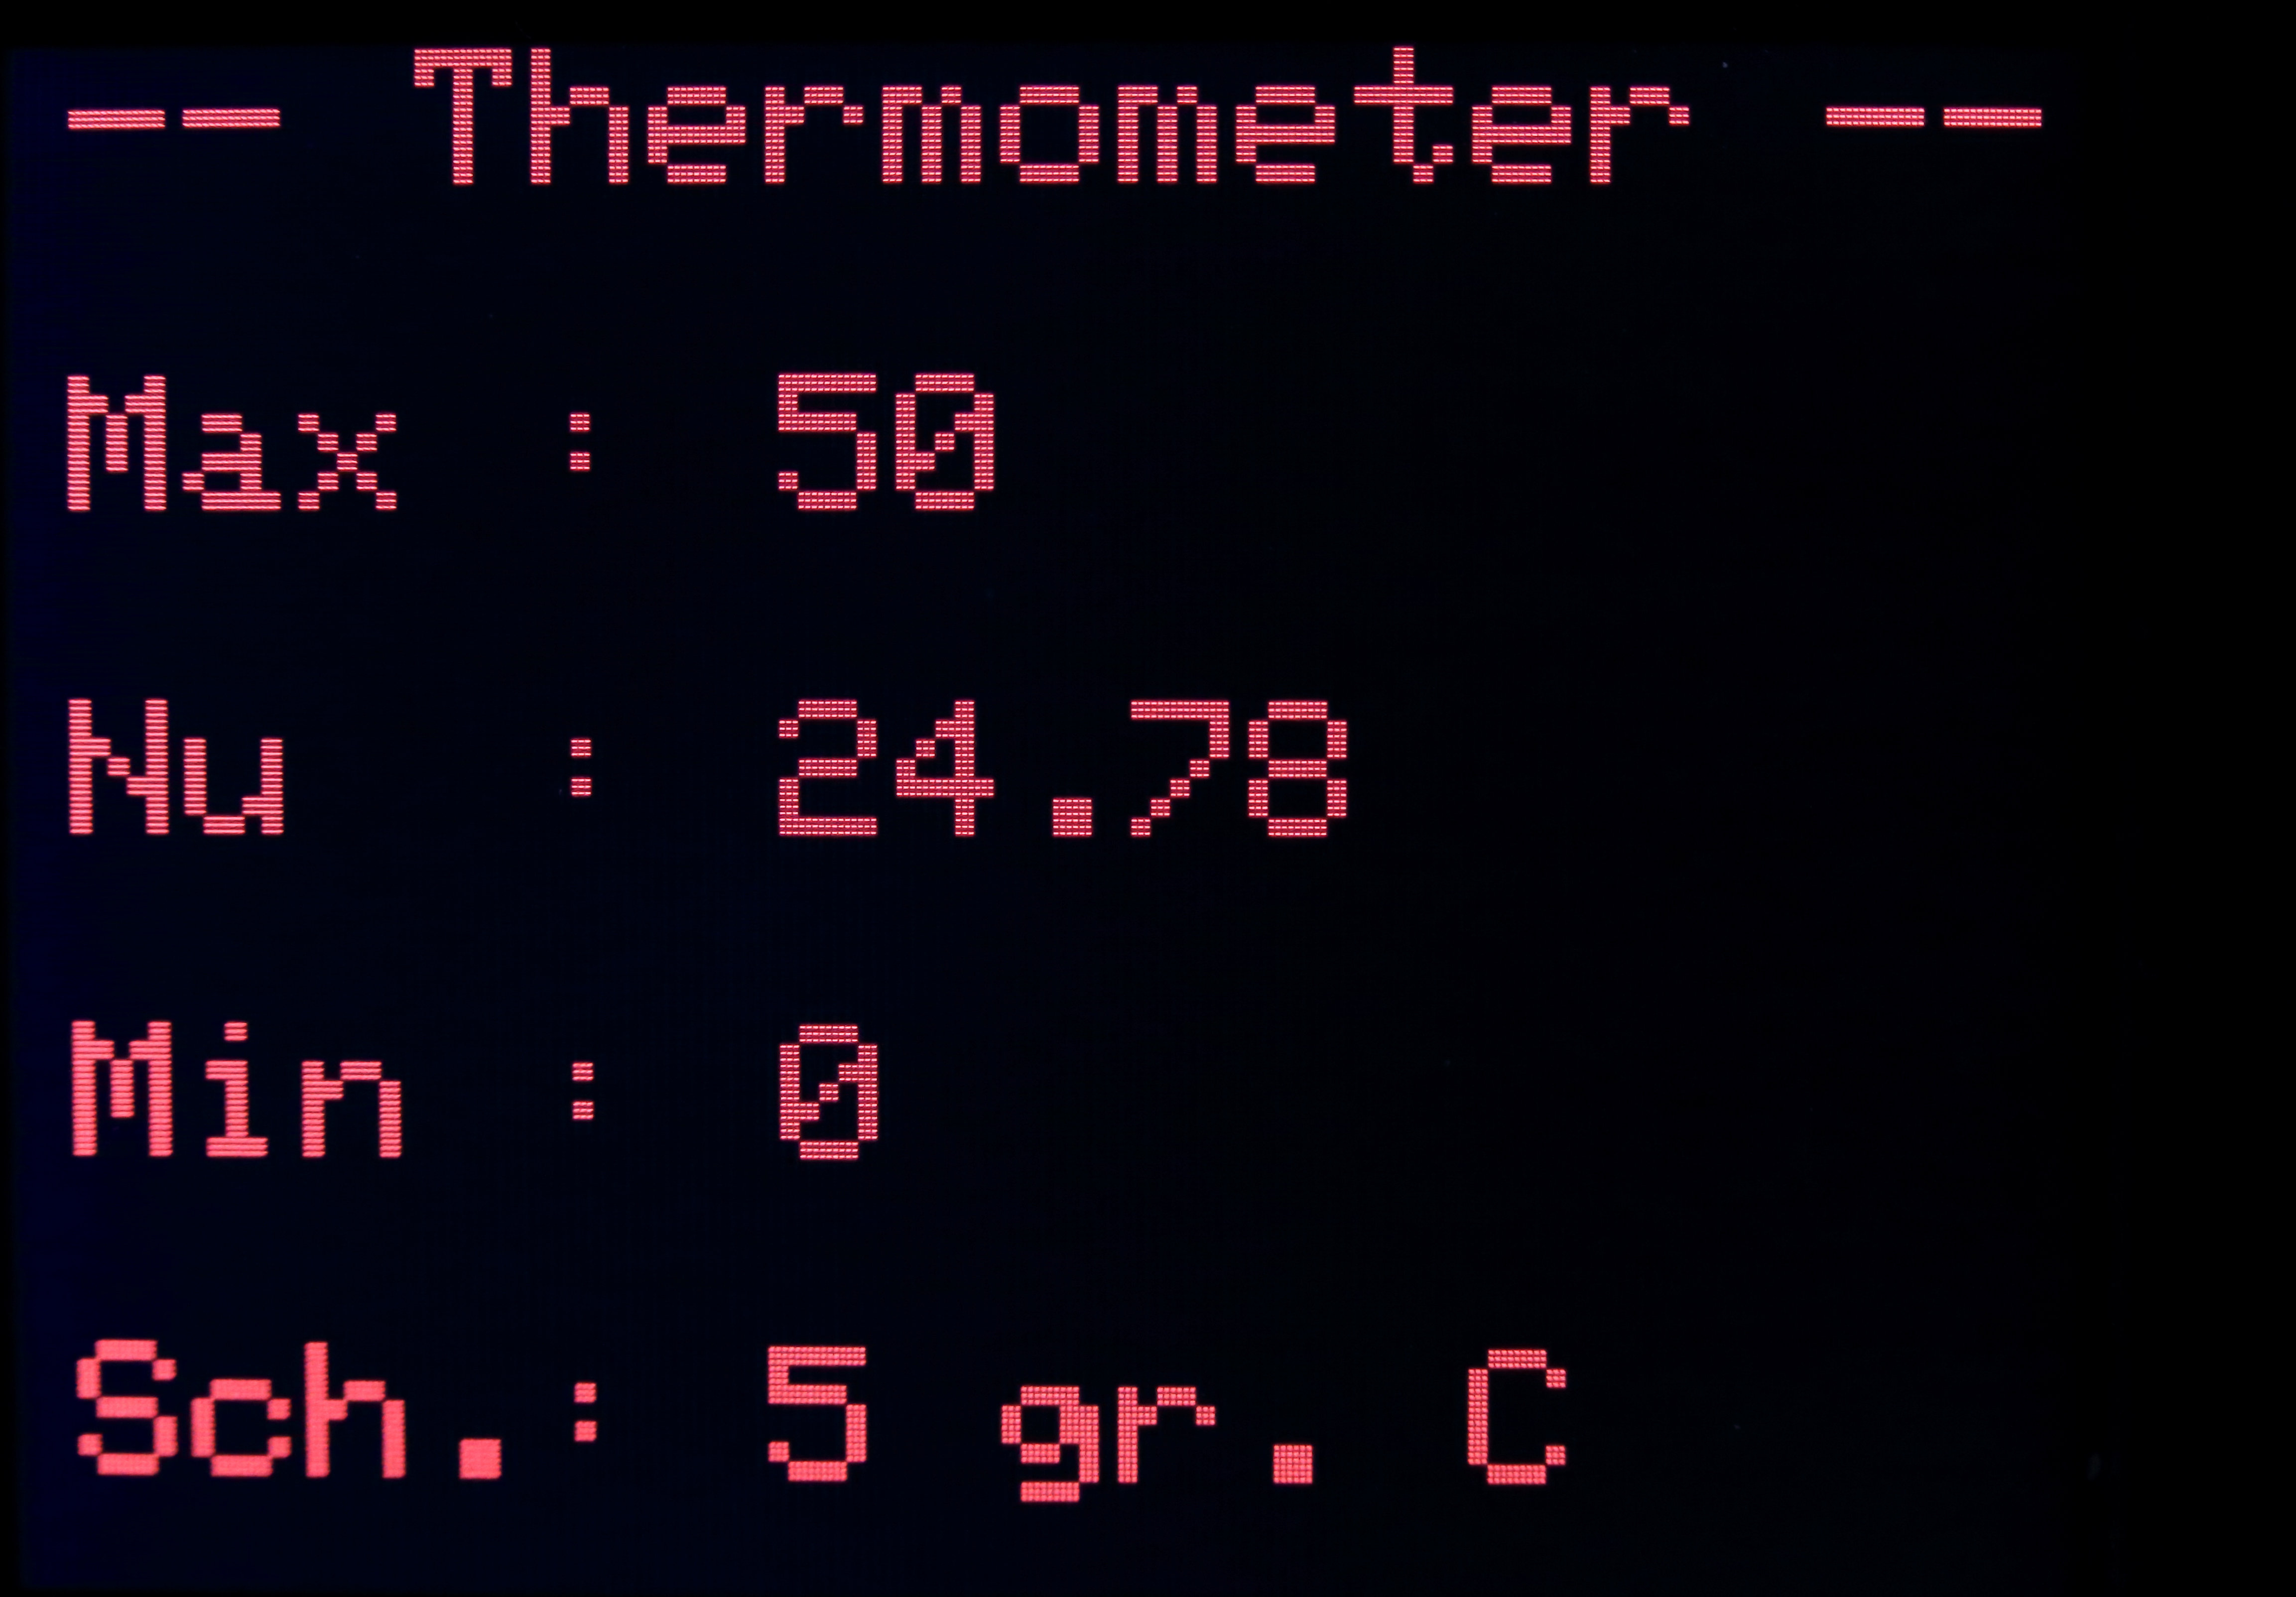
Function 0011: Temperature
Ledbar: indication of the temperature in degrees of celsius.
Display: Range is from 0 - 50 degrees Celsius.
Actual temperature.
Scale = 5 degrees celsius (1 led = 0.5 degree)
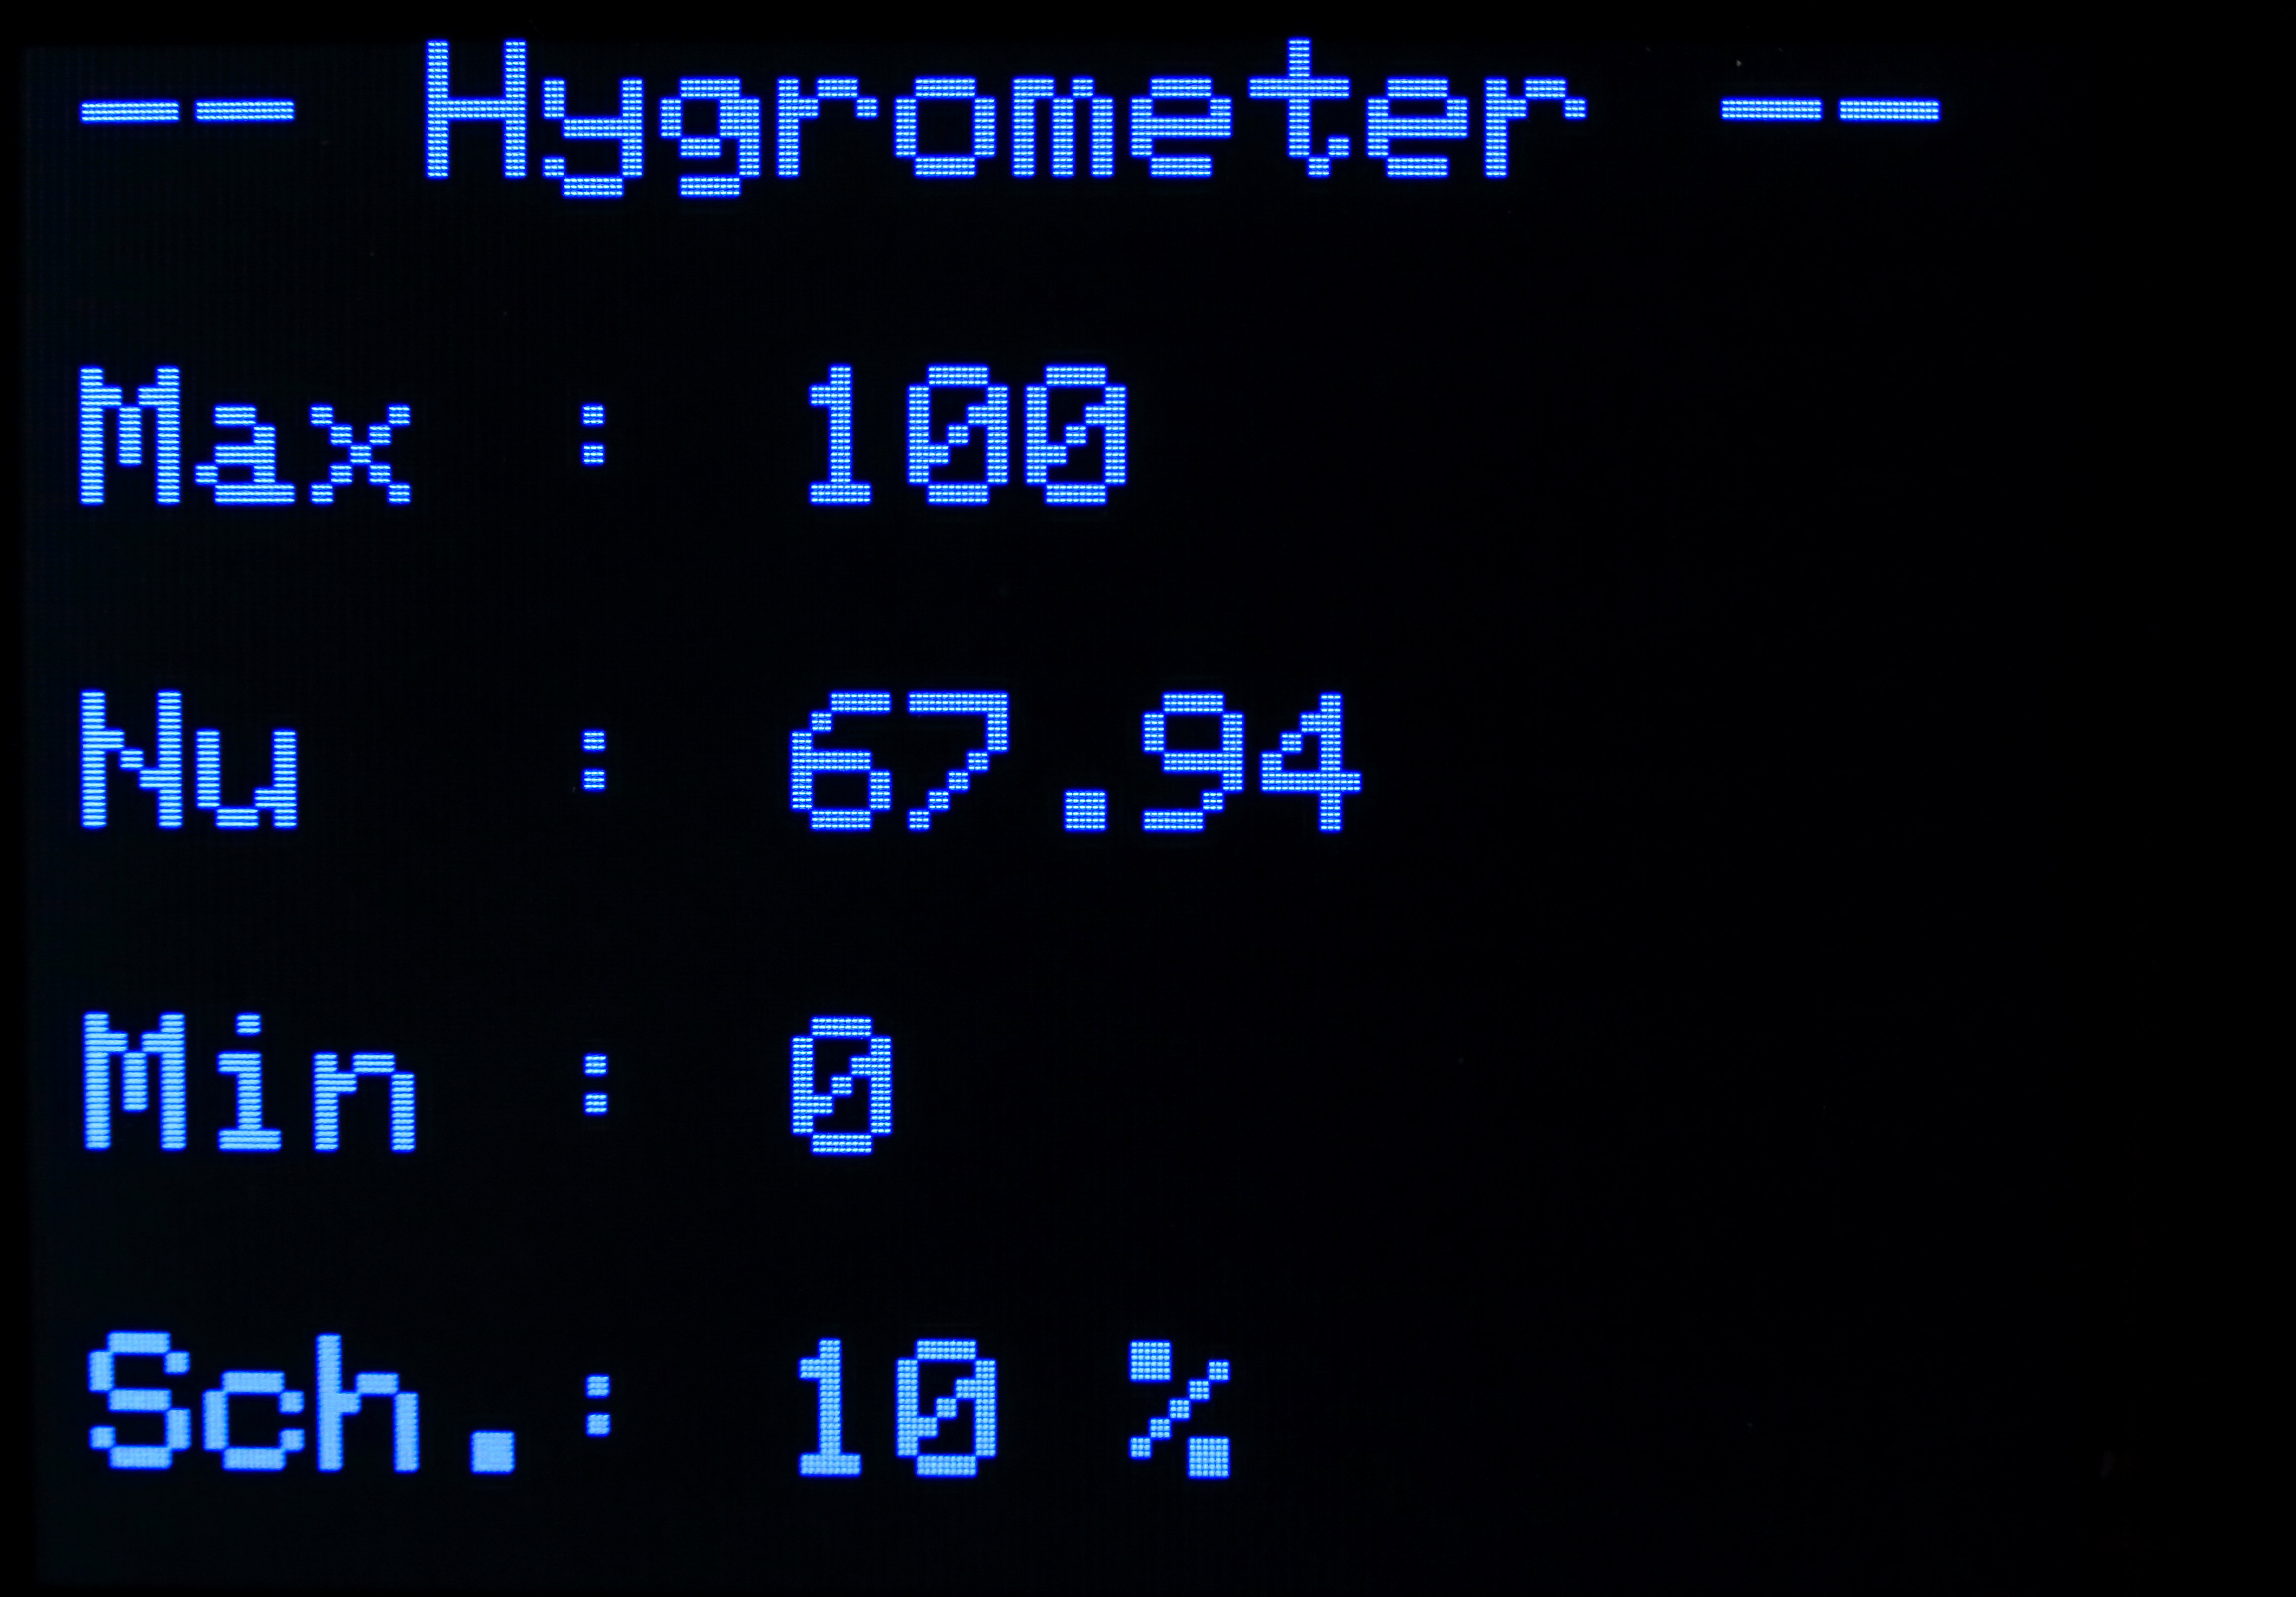
Function 0100: Humidity
Led bar: indication of the Humidity in %
Display: Range is from 0 - 100 % relative humidity.
Actual humidity.
Scale = 10 %. (1 led = 1 % relative humidity)
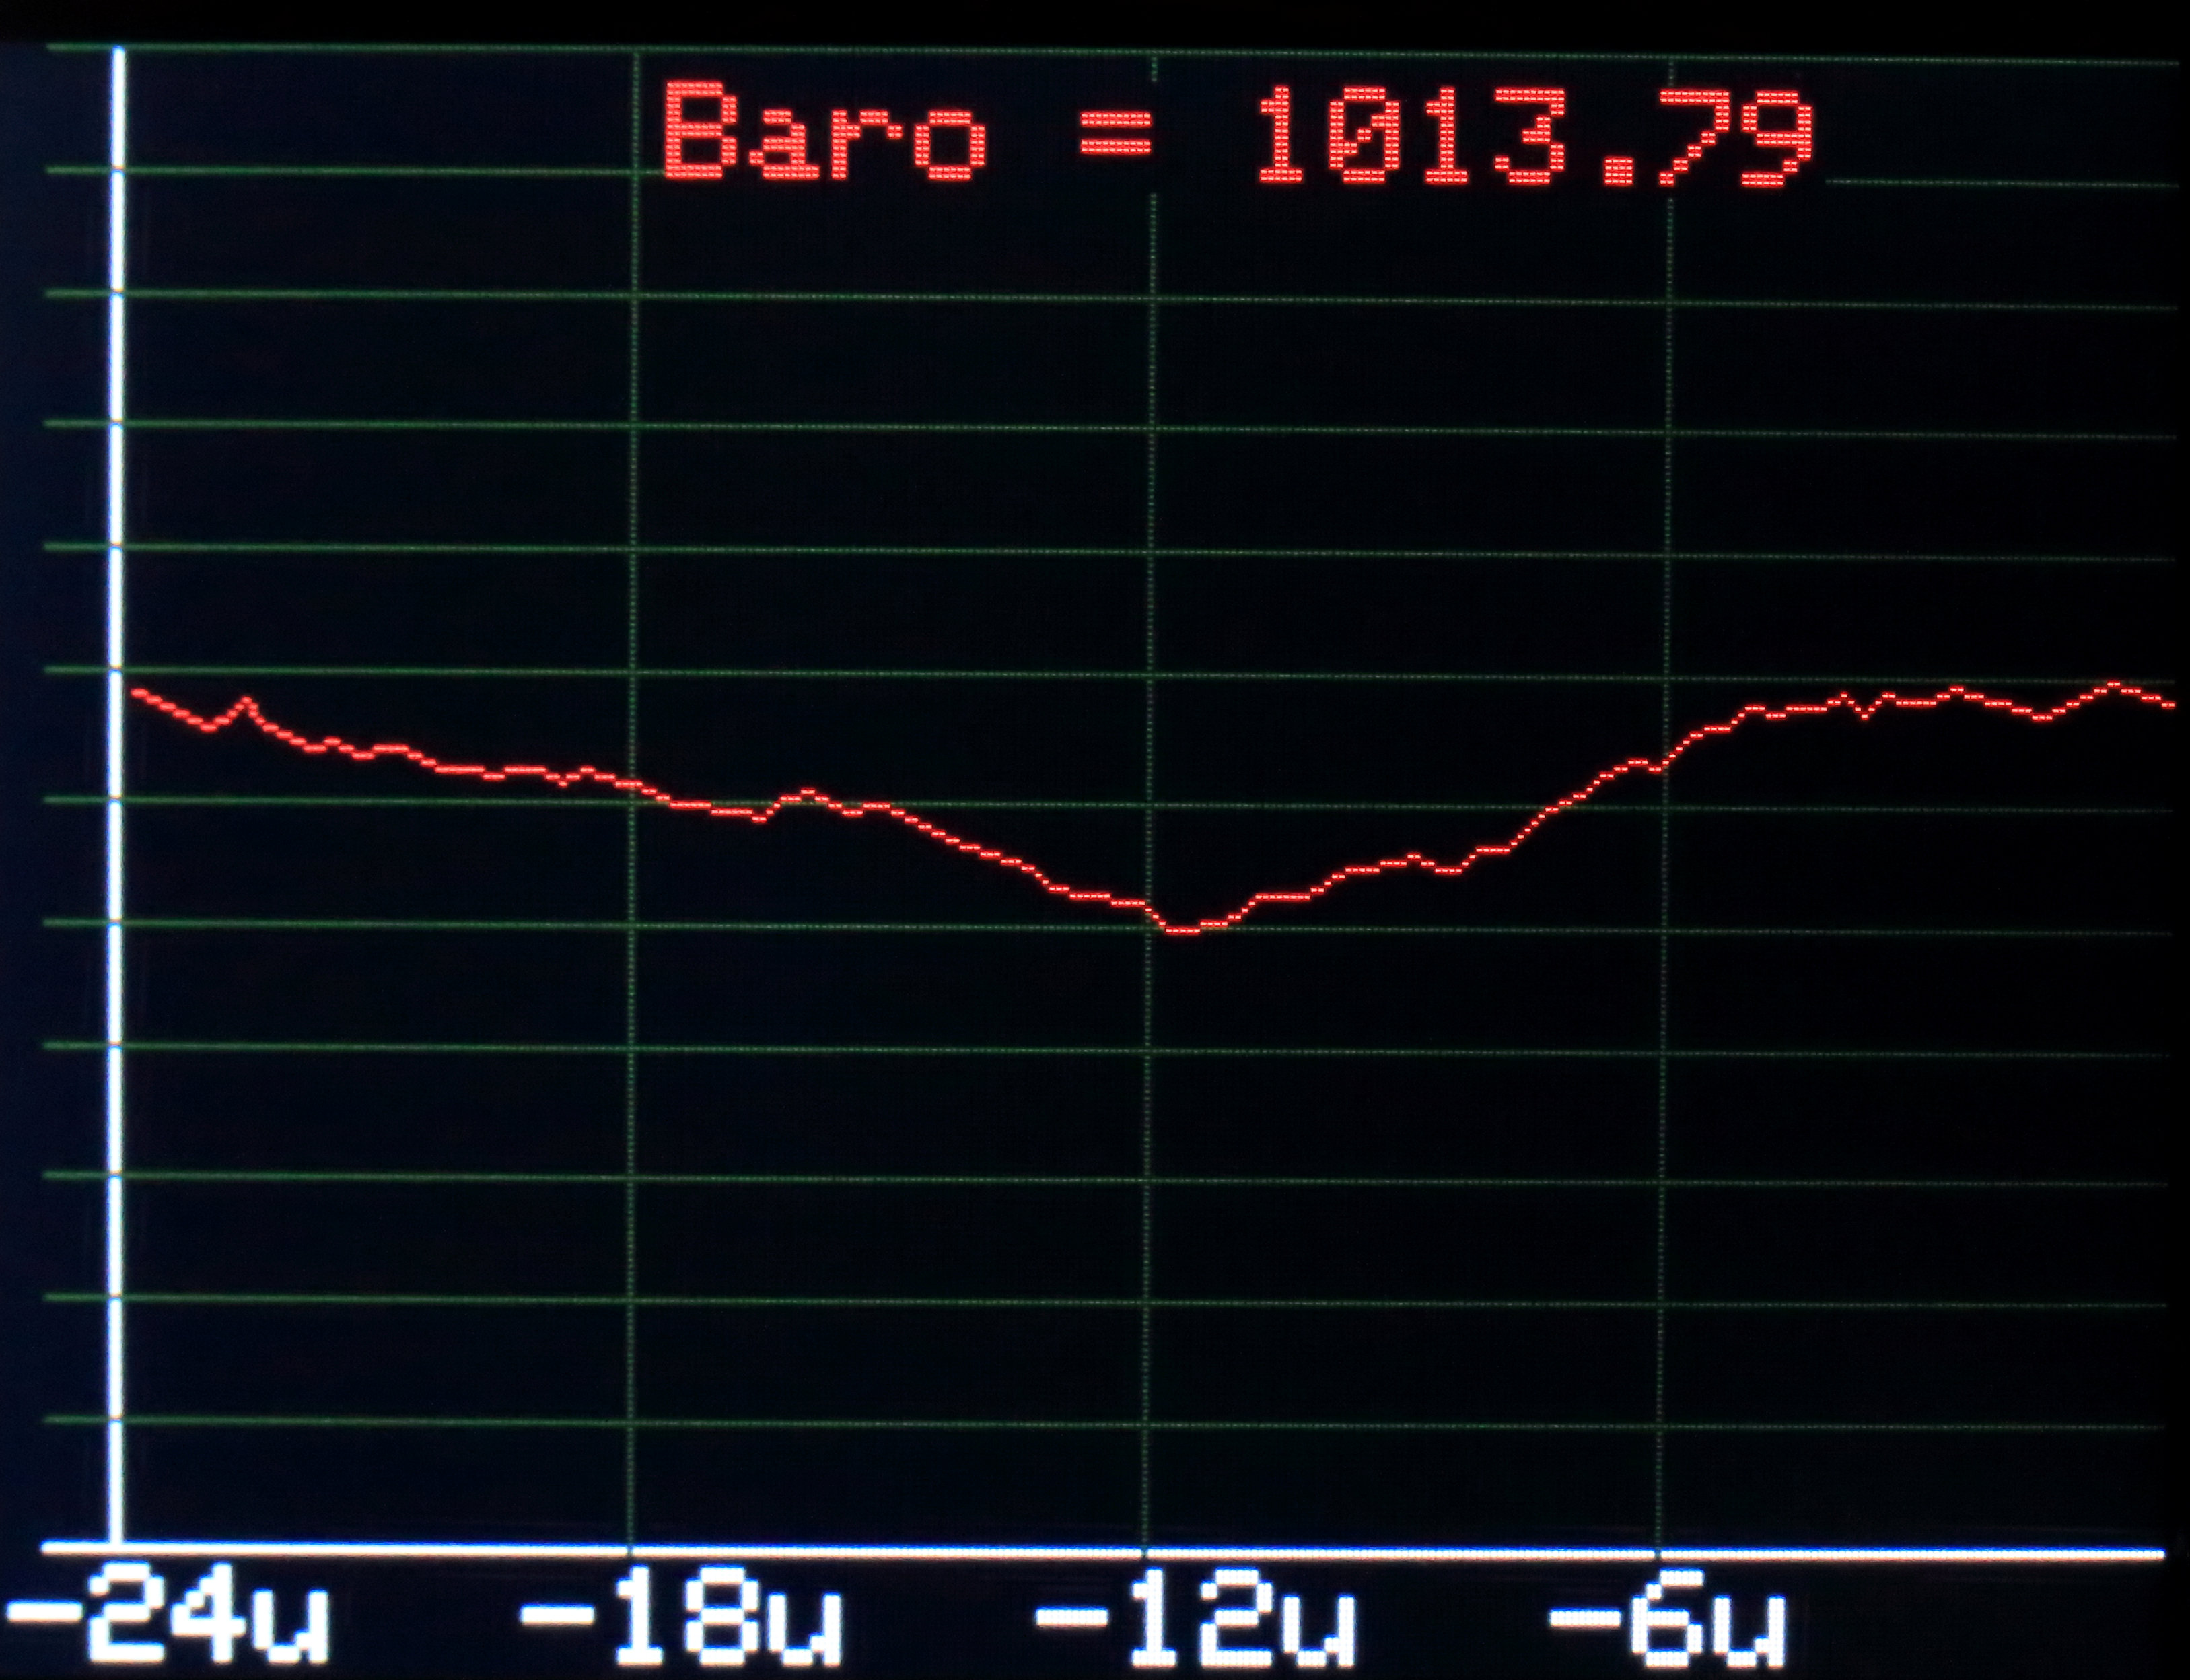
Function 0101:
Led bar: indication of the air pressure in mBar
Display: the trend of the air pressure of the last 24 hours
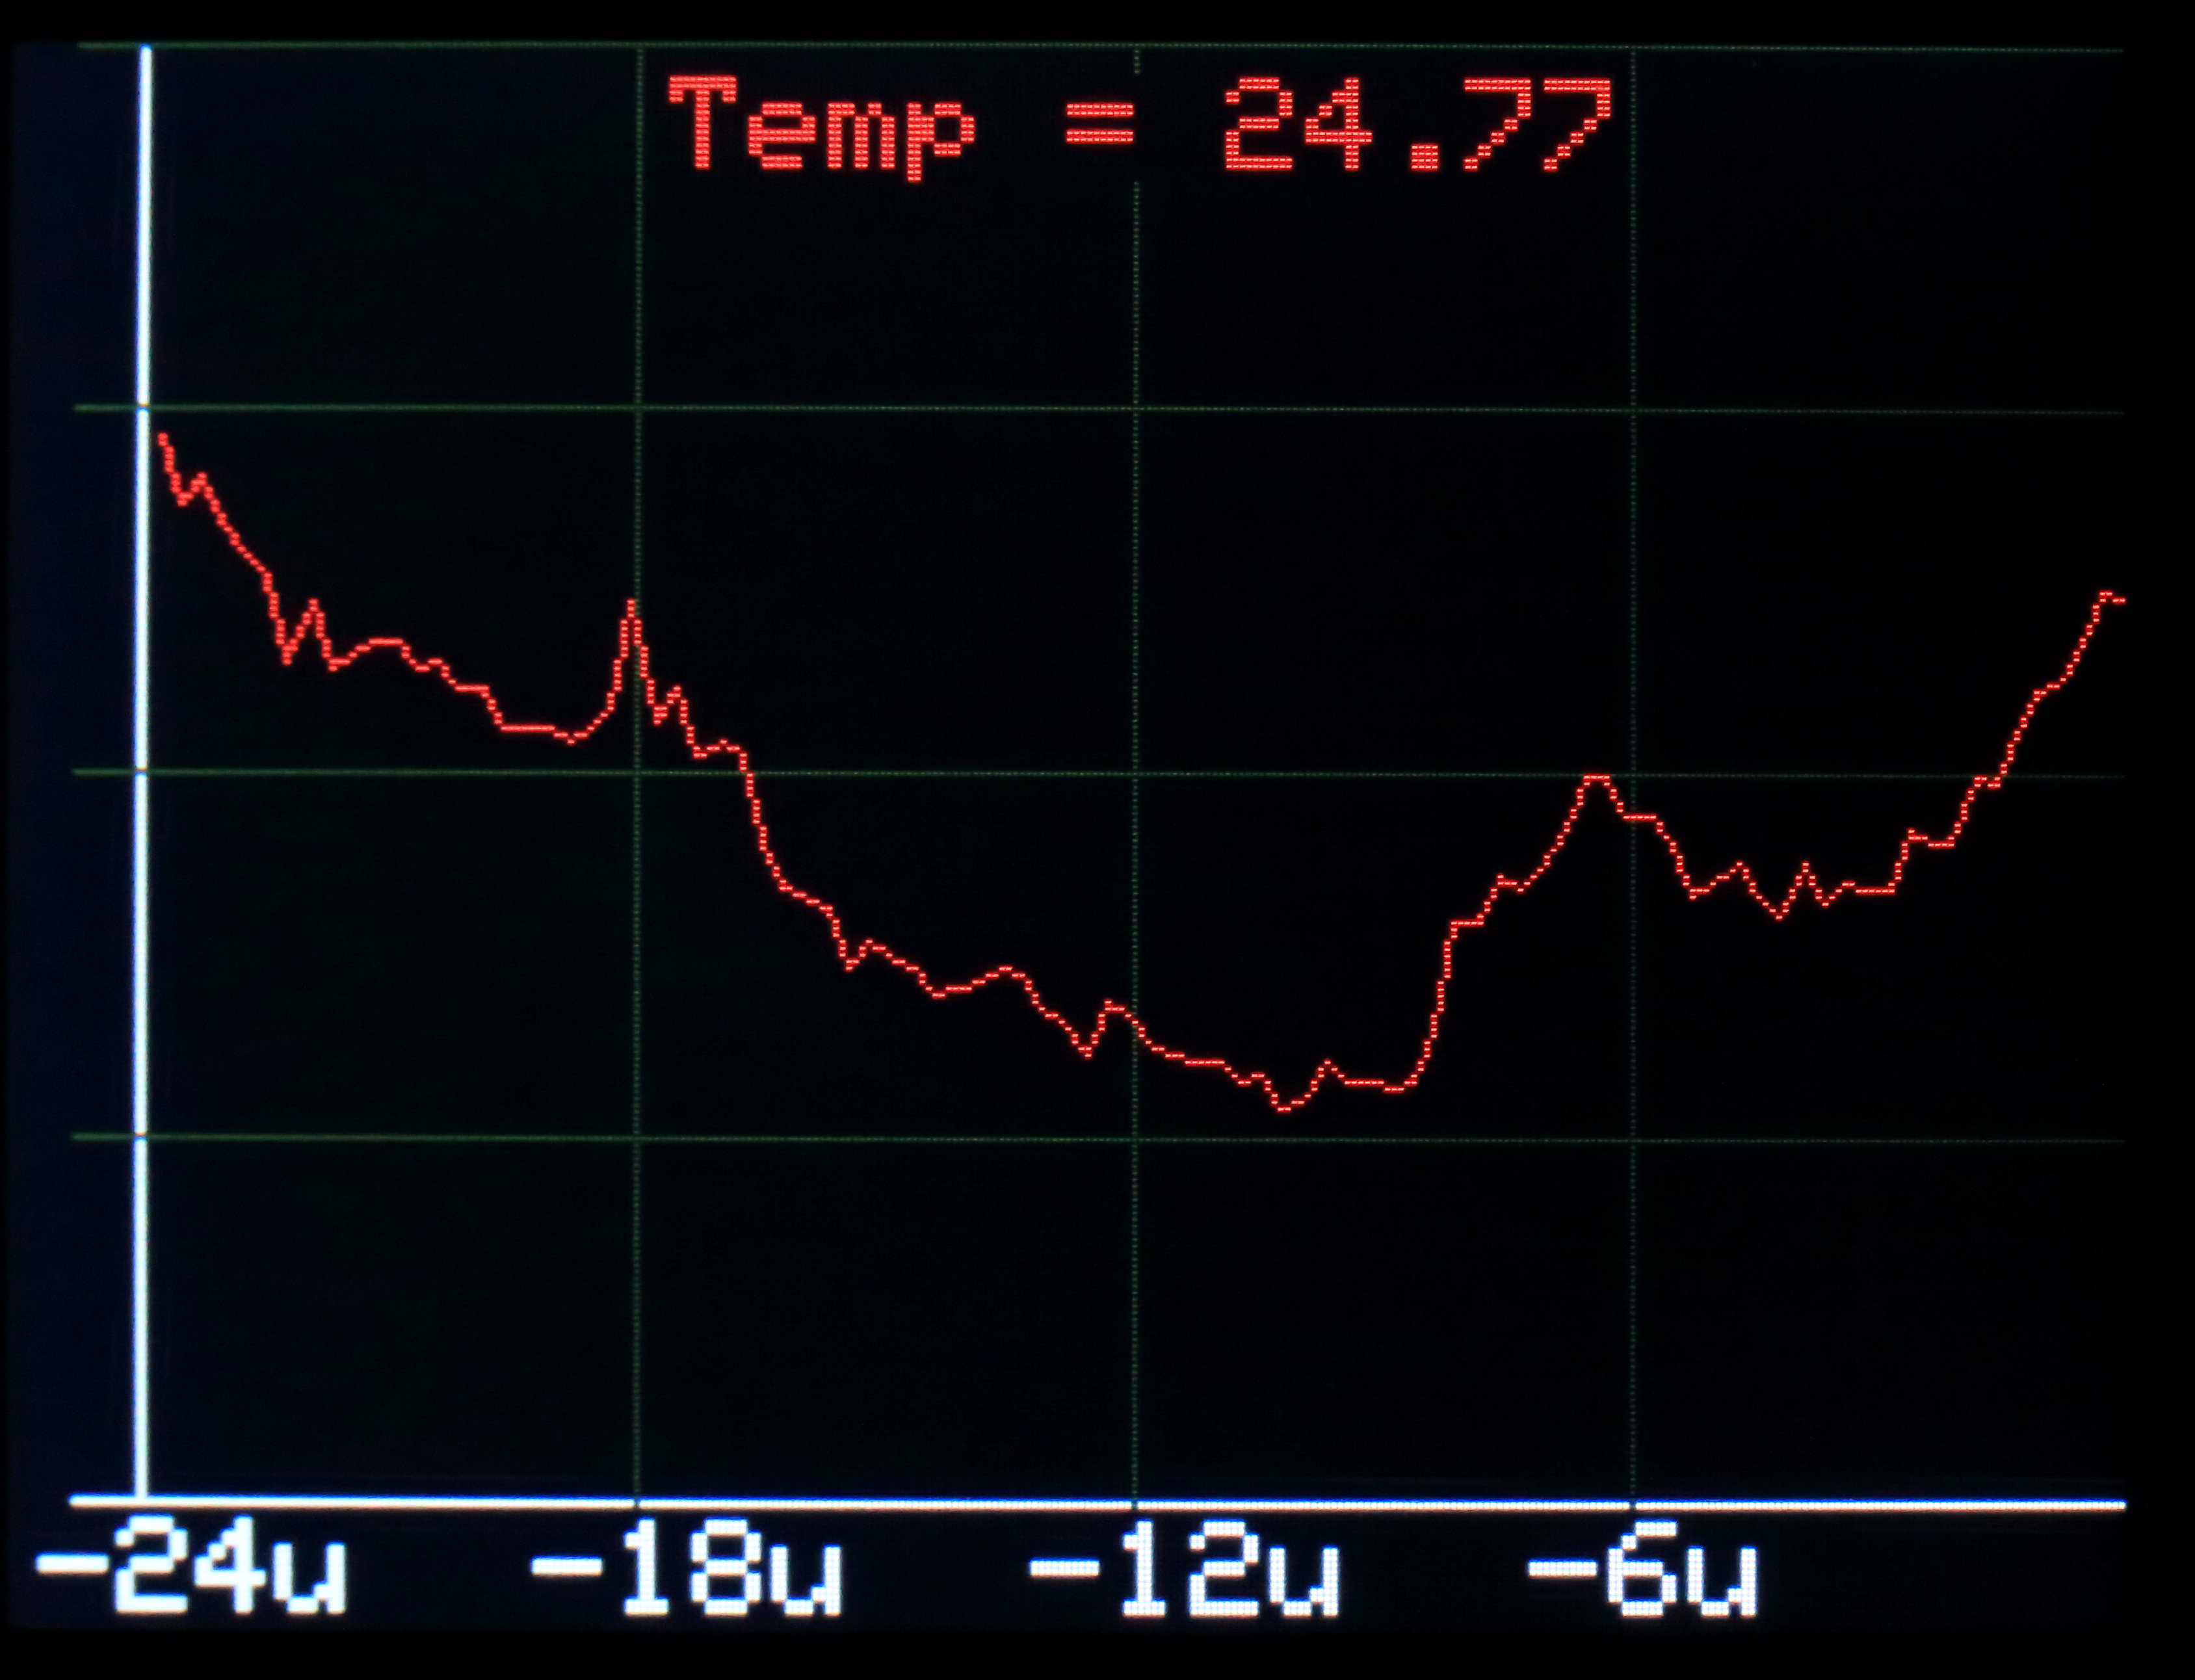
Function 0110:
Led bar: indication of the temperature in degrees of celsius.
Display: the trend of the temperature of the last 24 hours
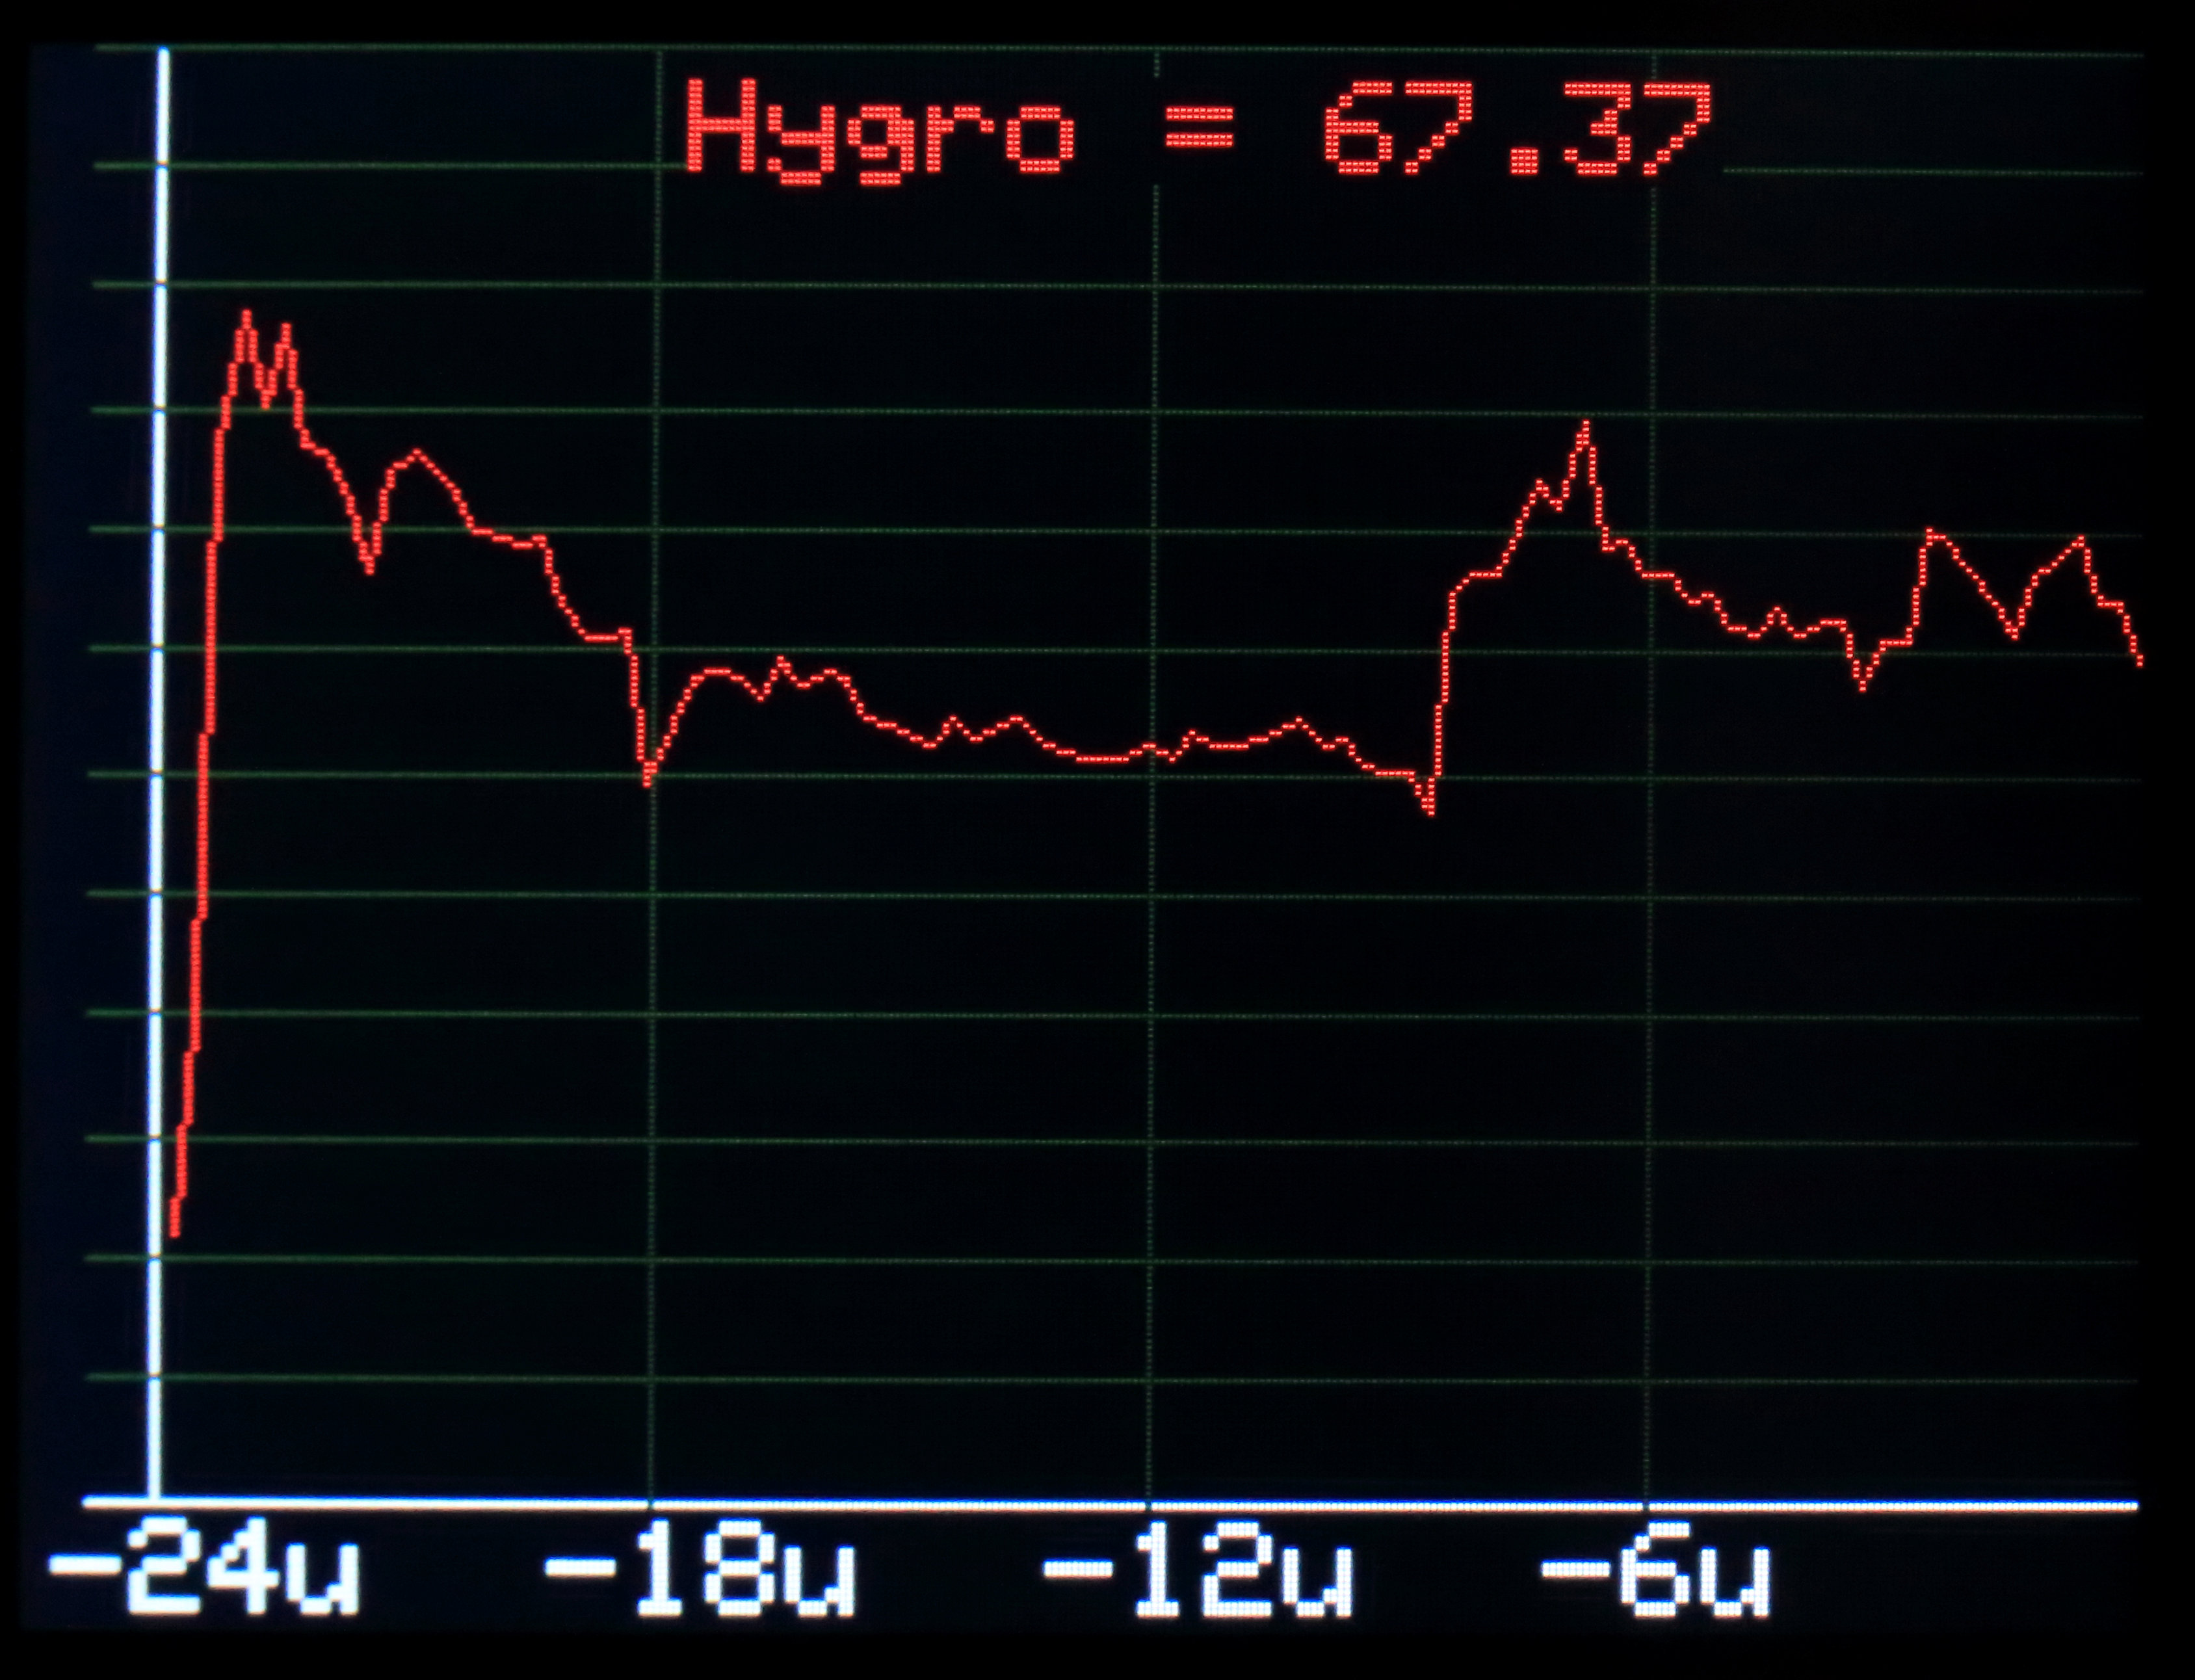
0111:
Led bar: indication of the relative humidity in %.
Display: the trend of the relative humidity of the last 24 hours
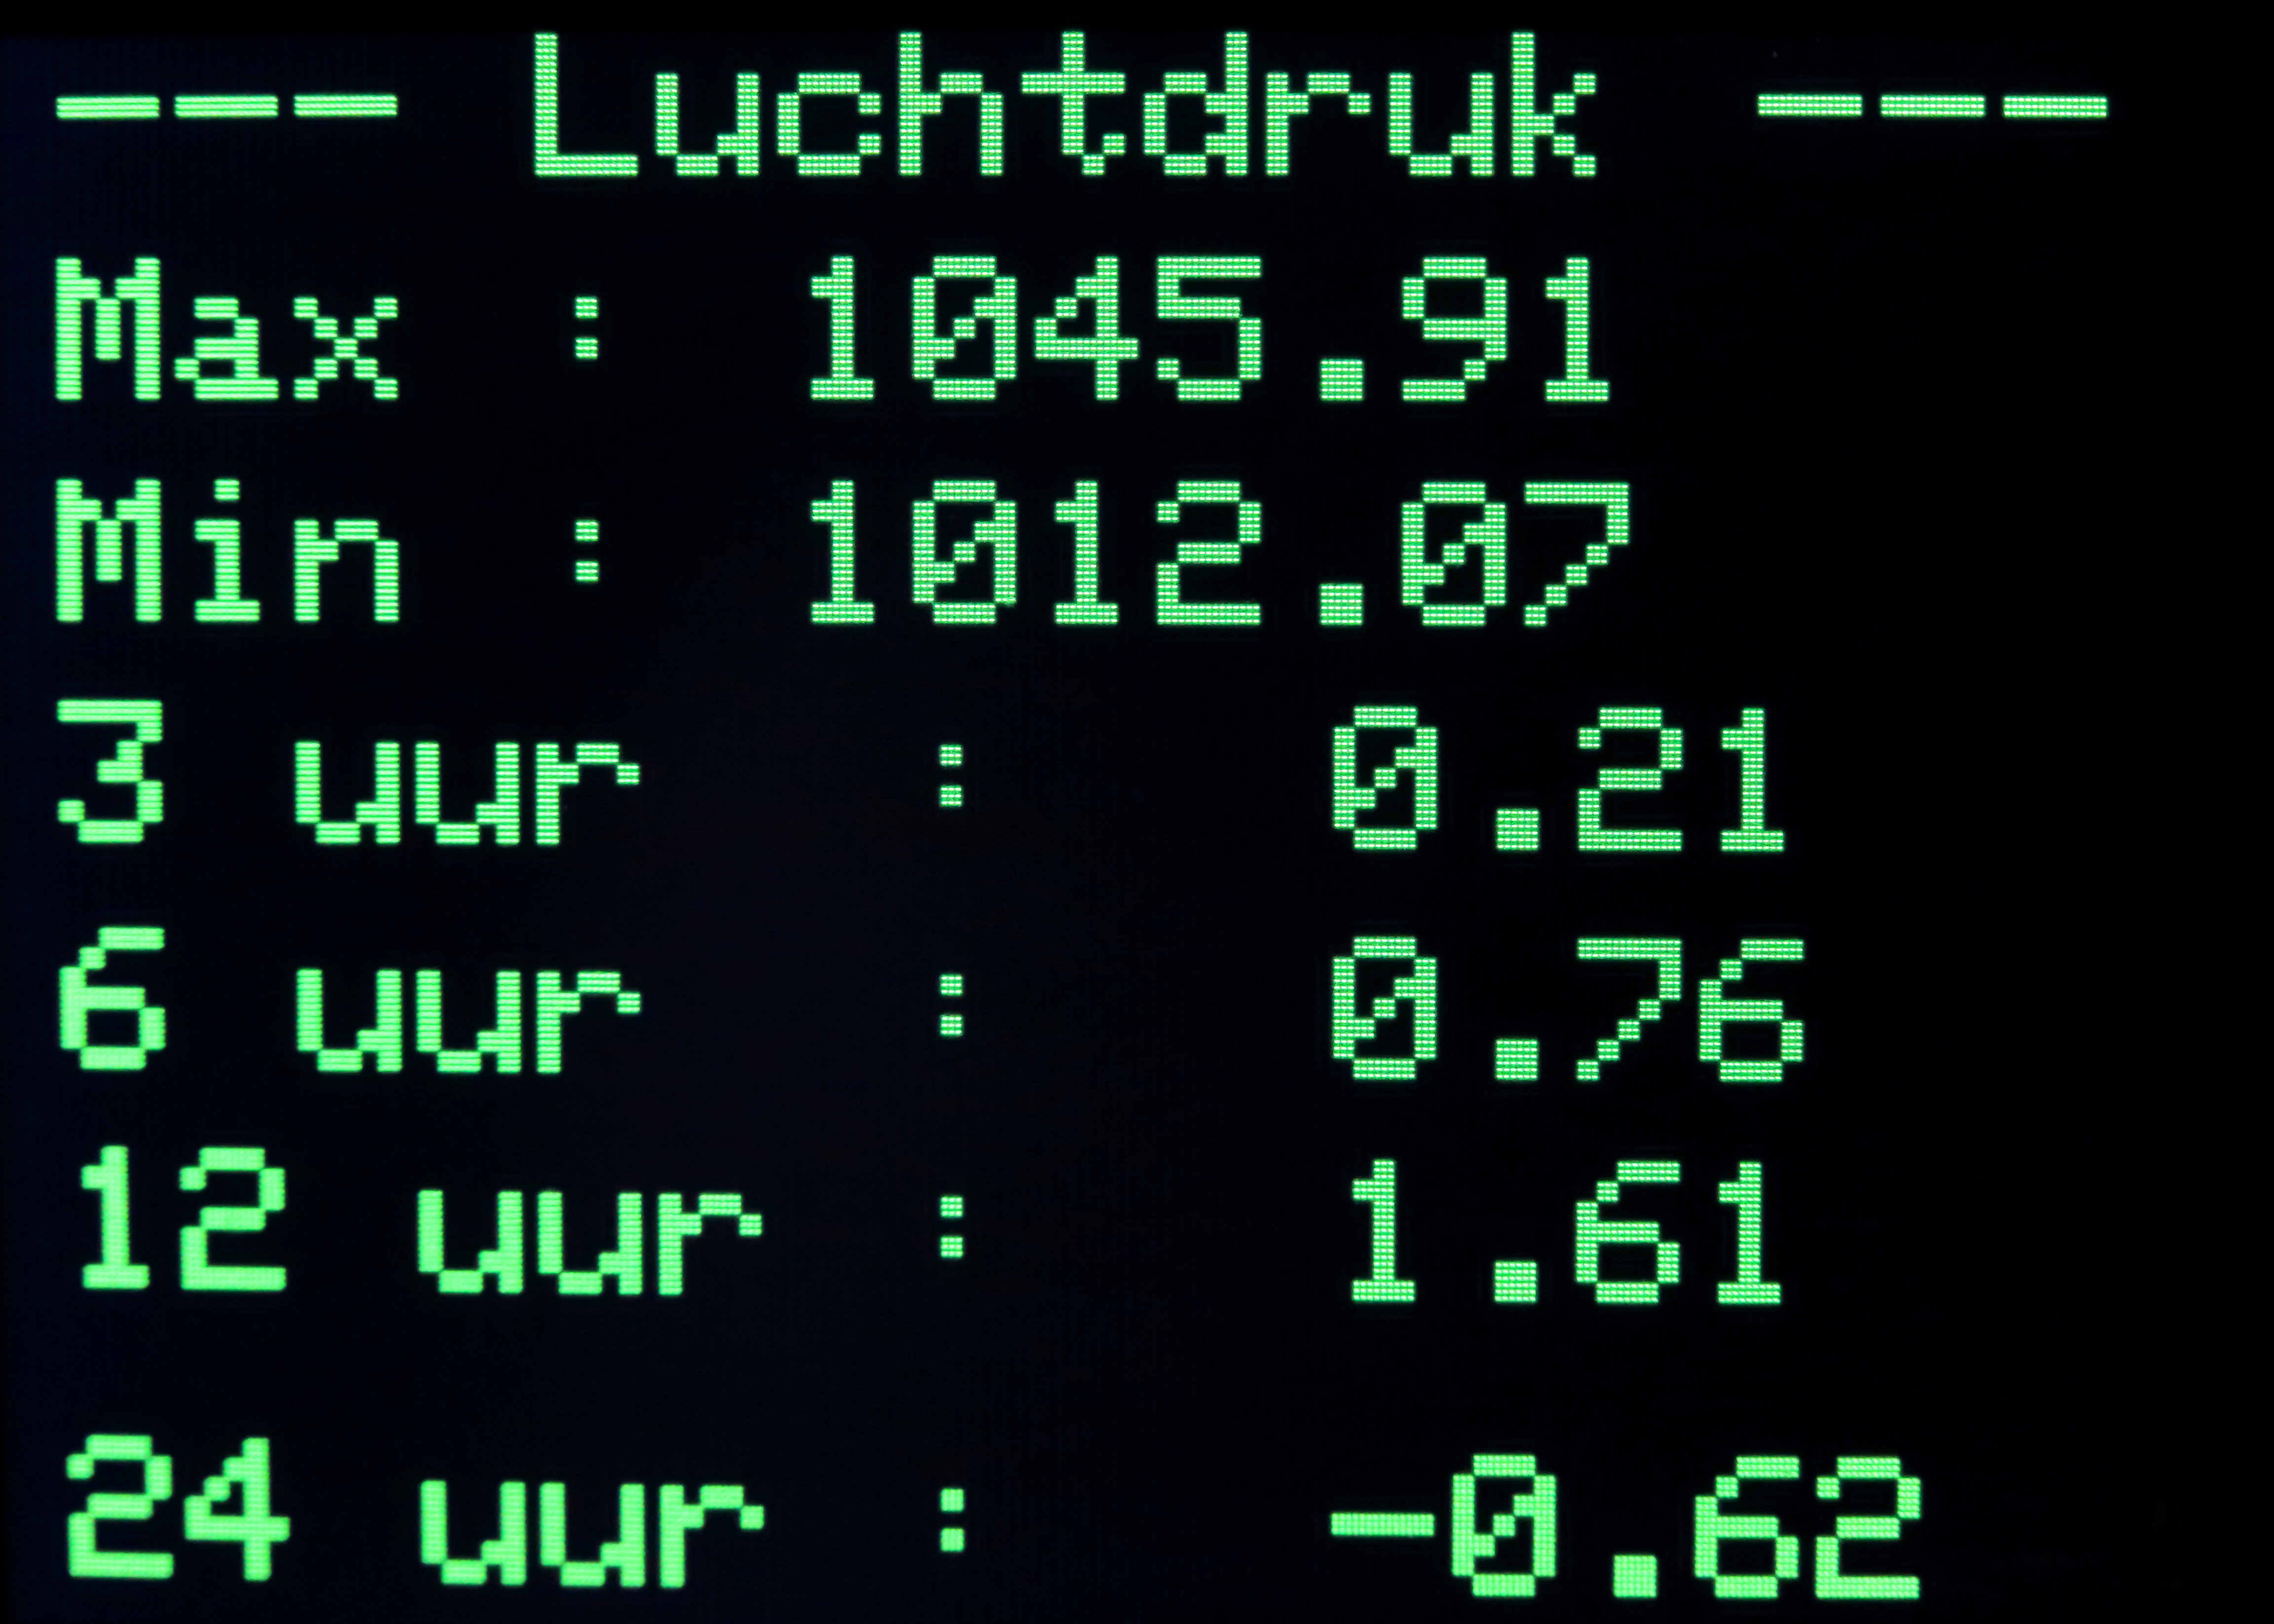
Function 1000:
Led bar: blank
Display: max and min values of the air pressure,
The 3,6,12 and 24 hours trend.
Function 1001:
Led bar: blank
Display: max and min values of temperature and humidity.
Those values are reset every 24 hours
Function 1010: Airpressure
This is the same as function 0010, except the led bar is in dot mode.
Function 1011: Temperature
This is the same as function 0011, except the led bar is in dot mode.
Function 1100: Hygro
This is the same as function 0100, except the led bar is in dot mode.
Function 1101: Airpressure zoom
This is the same as function 0010, except the scale is 10 times zoom.
Scale = 1 mBar ( 10 led = 1 mBar)
Function 1110: Temperature zoom
This is the same as function 0011, except the scale is 5 times zoom
Scale = 1 degree celsius (10 led = 1 degree)
Function 1100: Hygro zoom
This is the same as function 0100, except the scale is 10 times zoom
Scale = 1 %. (10 led = 1 % relative humidity)
EXPANDED TECHNICAL DETAILS
Atmospheric Pressure Diagnostics
This project is a high-precision digital recording tool for tracking altitude and localized weather shifts based on air pressure.
- BME280/BMP180 Integration: Interfaces with a specialized Bosch sensor over the I2C bus. These sensors can detect pressure changes as small as 1 Pa (Pascals), allowing the Arduino to calculate altitude changes with a resolution of just 1 meter.
- Sea-Level Calibration: The firmware includes a calibration variable for local Sea-Level Pressure (hPa/inHg), ensuring the calculated altitude remains accurate throughout the day.
Visualization Dashboard
- Cyclic Data Display: Current pressure (hPa), altitude (m), and temperature (°C) are cycled on an I2C OLED screen. The code includes a 24-hour "Trend" indicator (Rising/Stable/Falling) to help predict incoming storm systems.