This is my third project with Arduino.
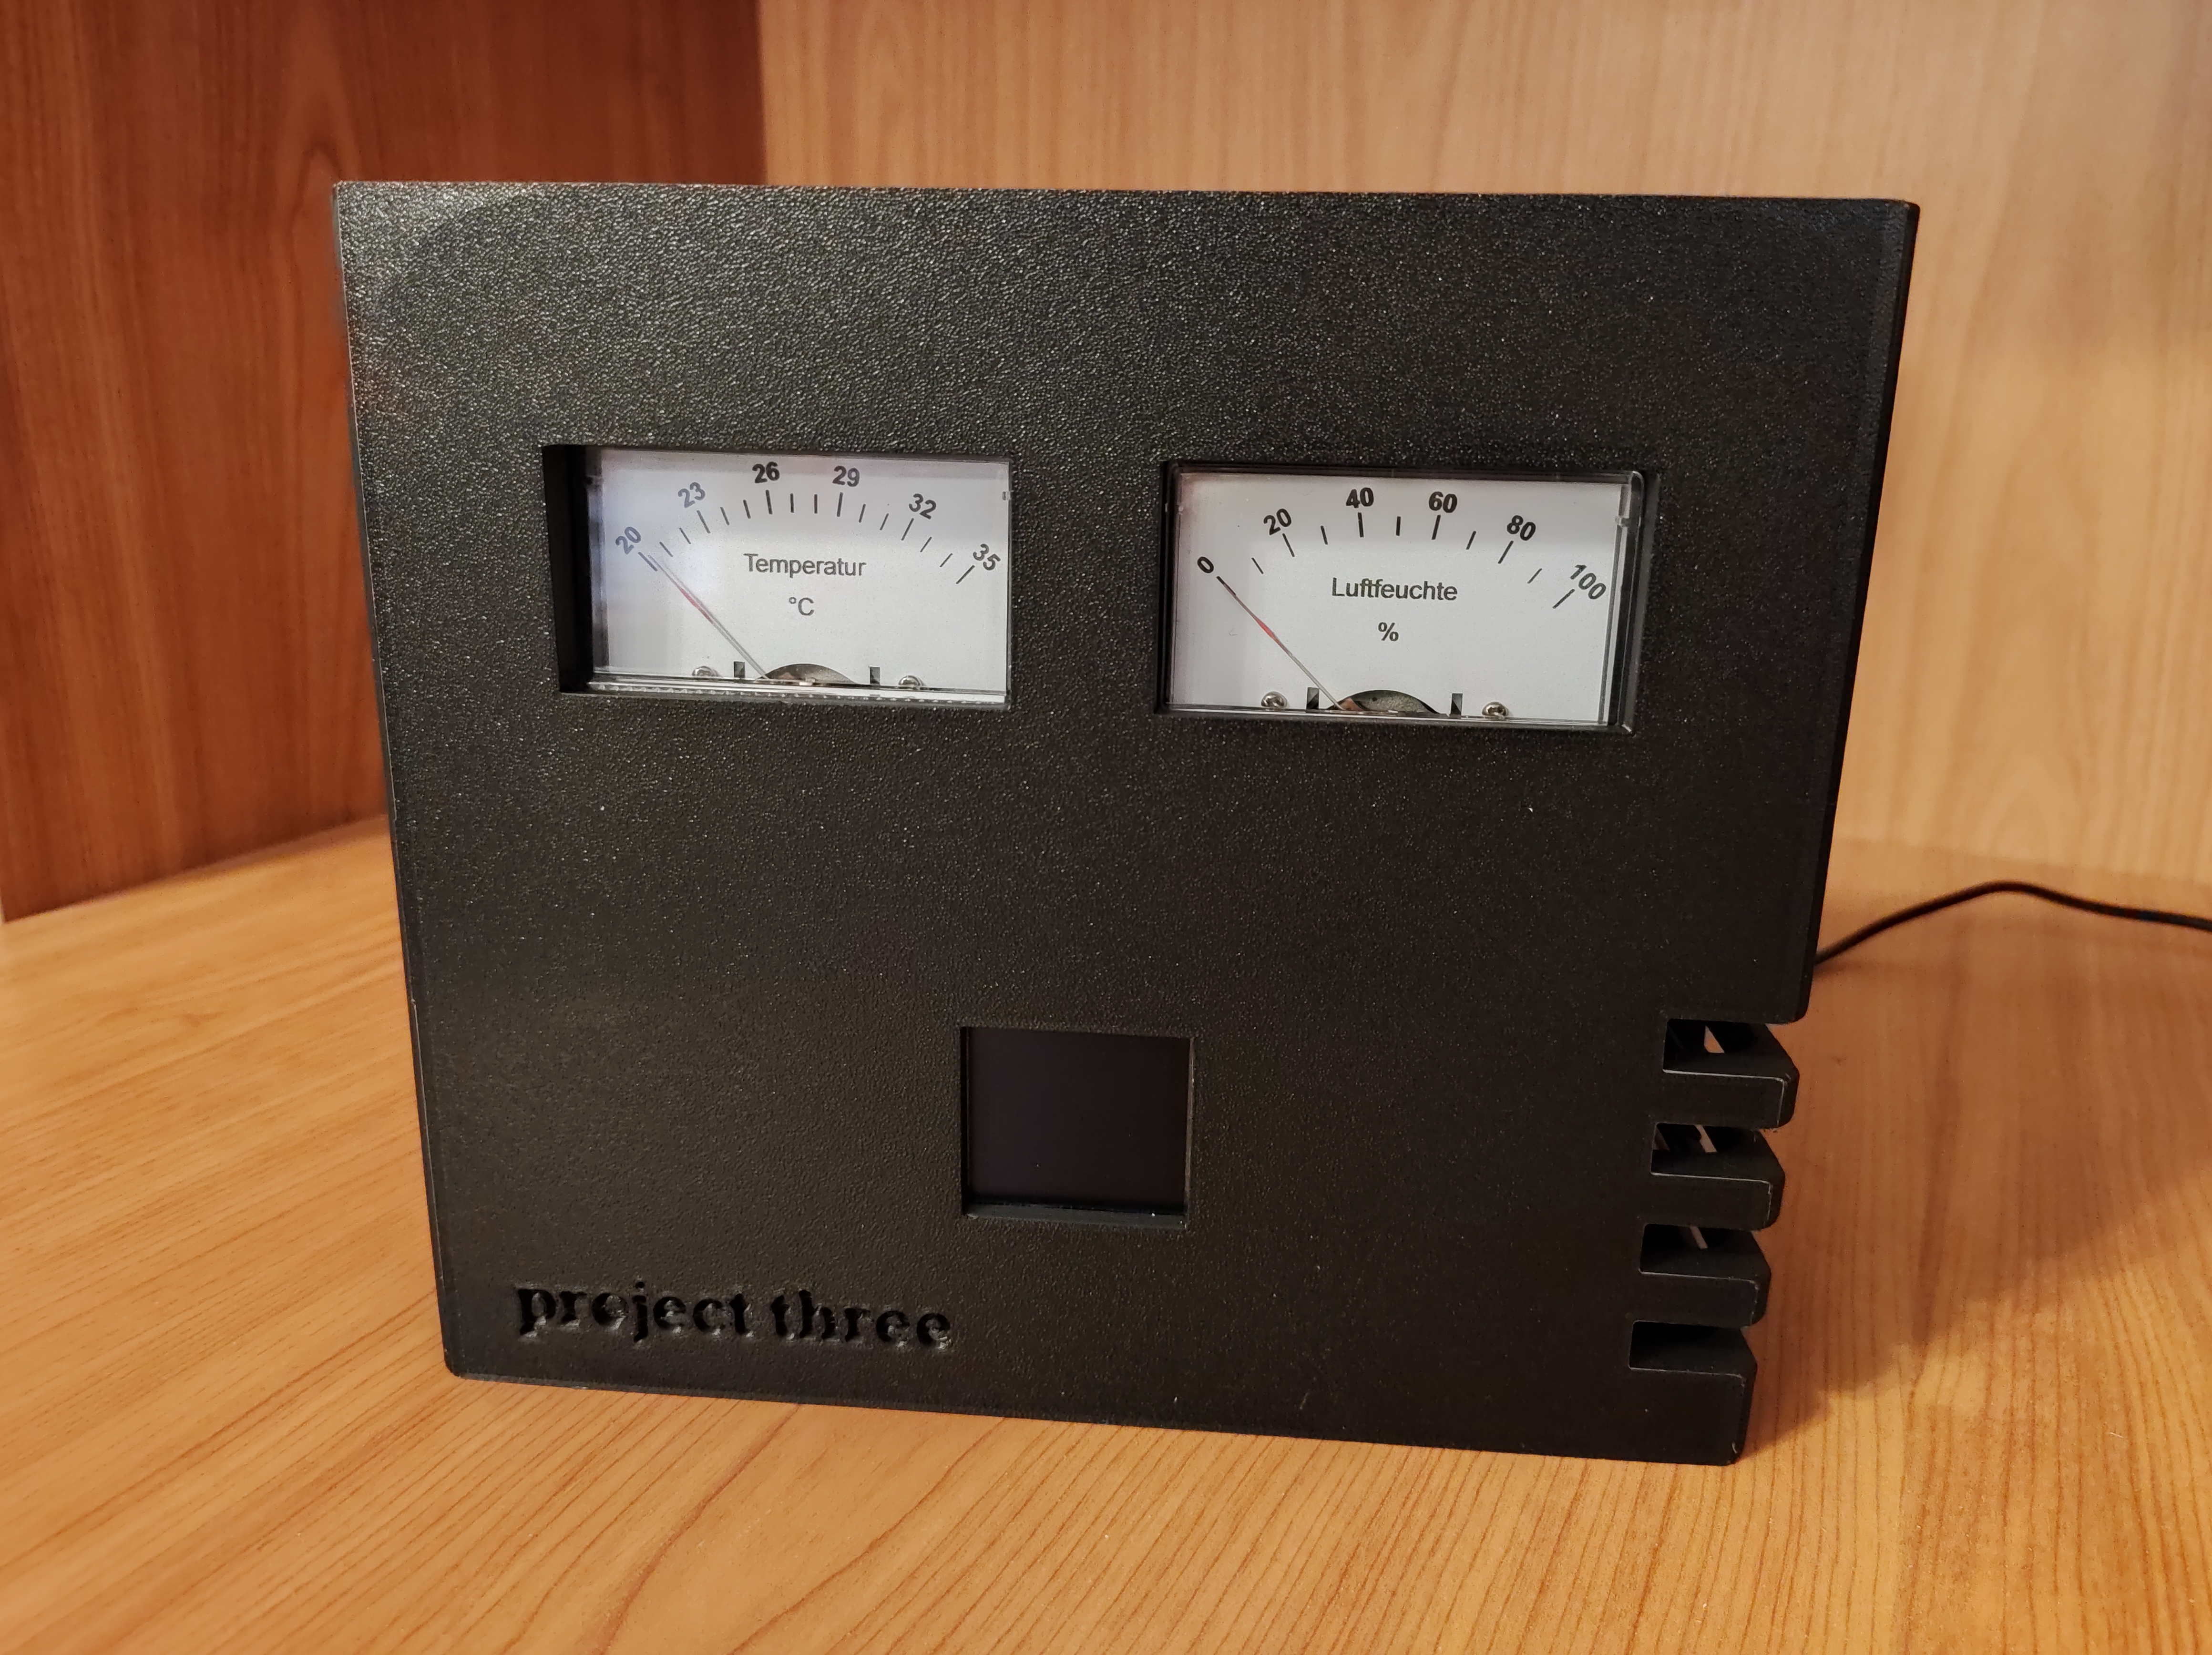
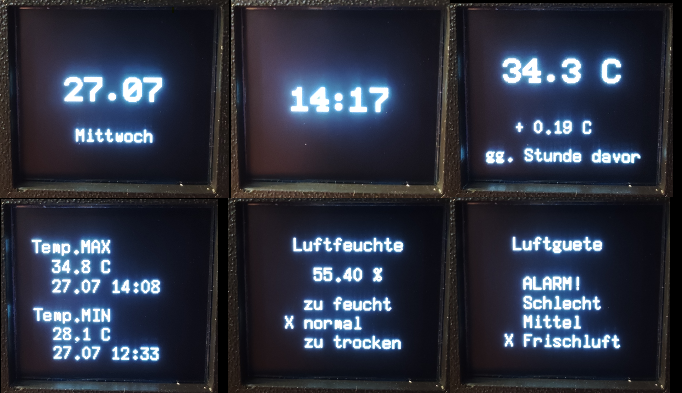
This device measures the temperature, the humidity and the air quality. These measurement data are displayed on a 1.5 inch OLED display as well on two analog voltmeters. The OLED display alternates between the date, the time, the current temperature with a comparison of the temperature one hour ago, the max and min temperature with an indication of the date and time, the humidity and the air quality.
Further there is a button to turn on / off the OLED display. Two RGB LEDS warn if a limit has been exceeded (temperature and humidity).
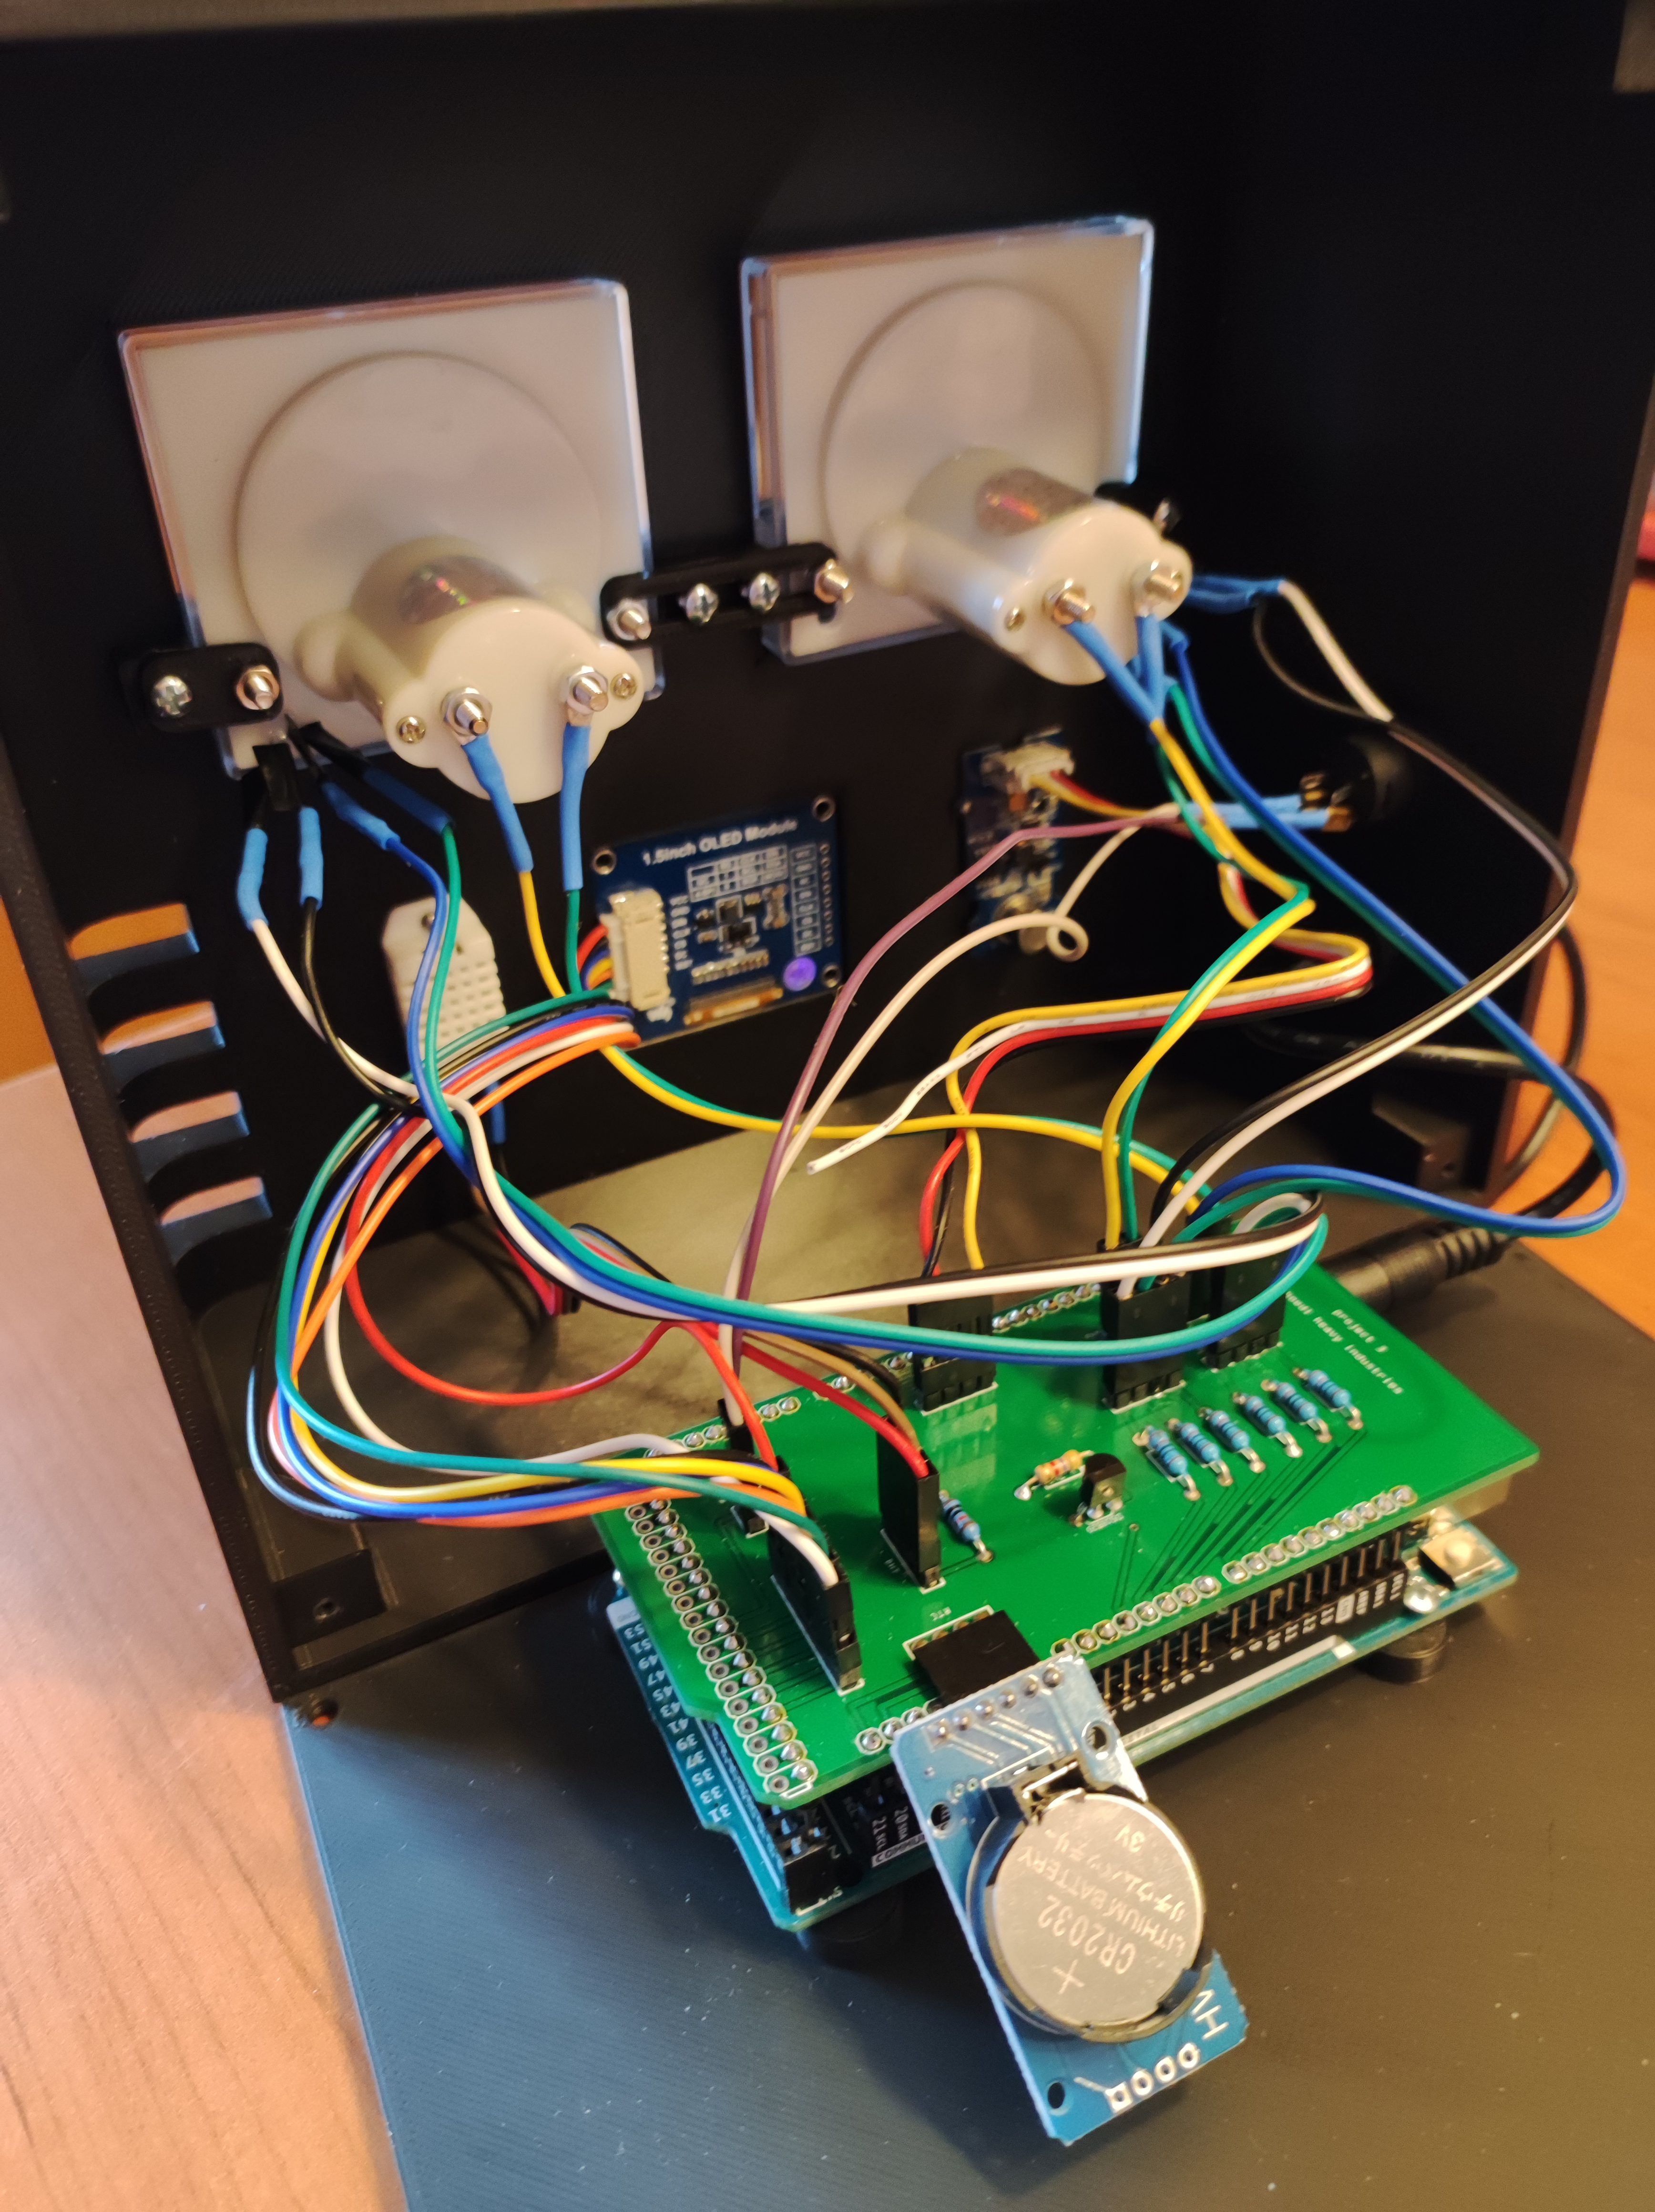
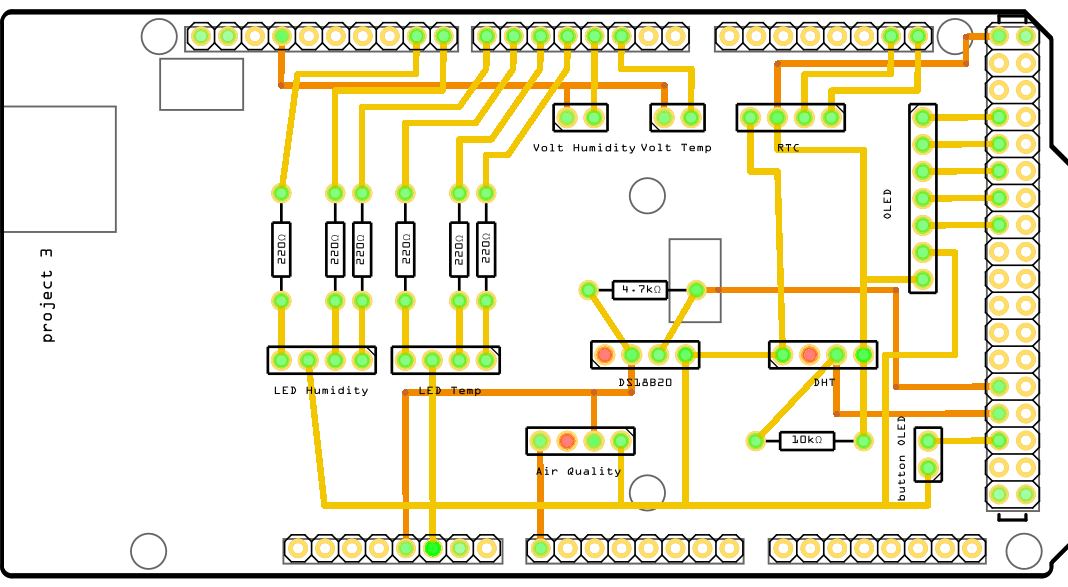
I designed the casing and the PCB (you can download the files below).The casing consists of 2 parts, the front - and the back side.
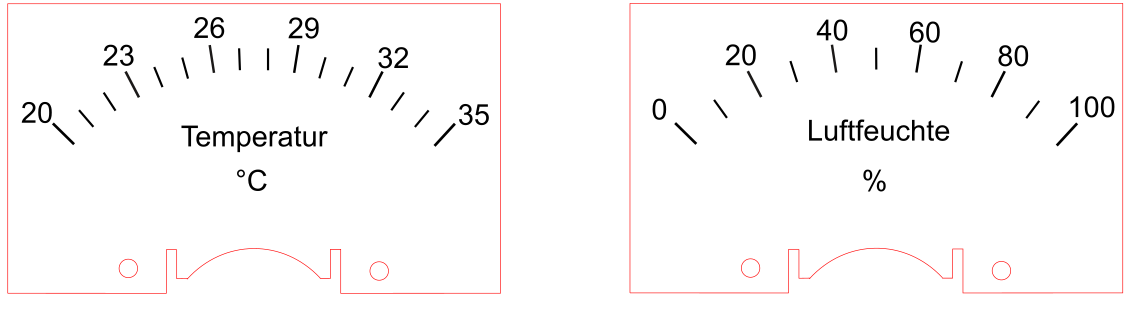
The displays of the two voltmeters were created with a vector graphics editor and then printed on a lasercutter. Both the cutting function and the engraving were used.
Technical Implementation: Sensor Fusion and PWM Analog Mapping
The project reveals the hidden layers of simple sensing-to-meter interaction:
- Identification layer: The DHT22 and Air Quality sensors act as high-resolution environmental inputs, measuring humidity and pollutant levels to coordinate status updates.
- Conversion layer: The system uses high-speed digital Pins to receive sensor data and generate PWM pulses to drive the mission-critical meter-needle tasks.
- Digital Interface layer: A Graphic OLED Display provides a high-definition data dashboard for climate status checks (e.g., Max/Min Temperature history).
- Analog Interface layer: Two Vintage Voltmeters provide high-precision and reliable mechanical feedback for climate observation.
- Processing Logic layer: The Arduino Mega code follows a "temporal-averaging" strategy: it interprets the sensor values and matches them to PWM duty-cycles to provide safe and rhythmic needle movement.
- Visual Warning Dialogue Loop: RGB LEDs pulse rhythmically to indicate status during initial calibration or when limits are exceeded.
Hardware-Enviro Infrastructure
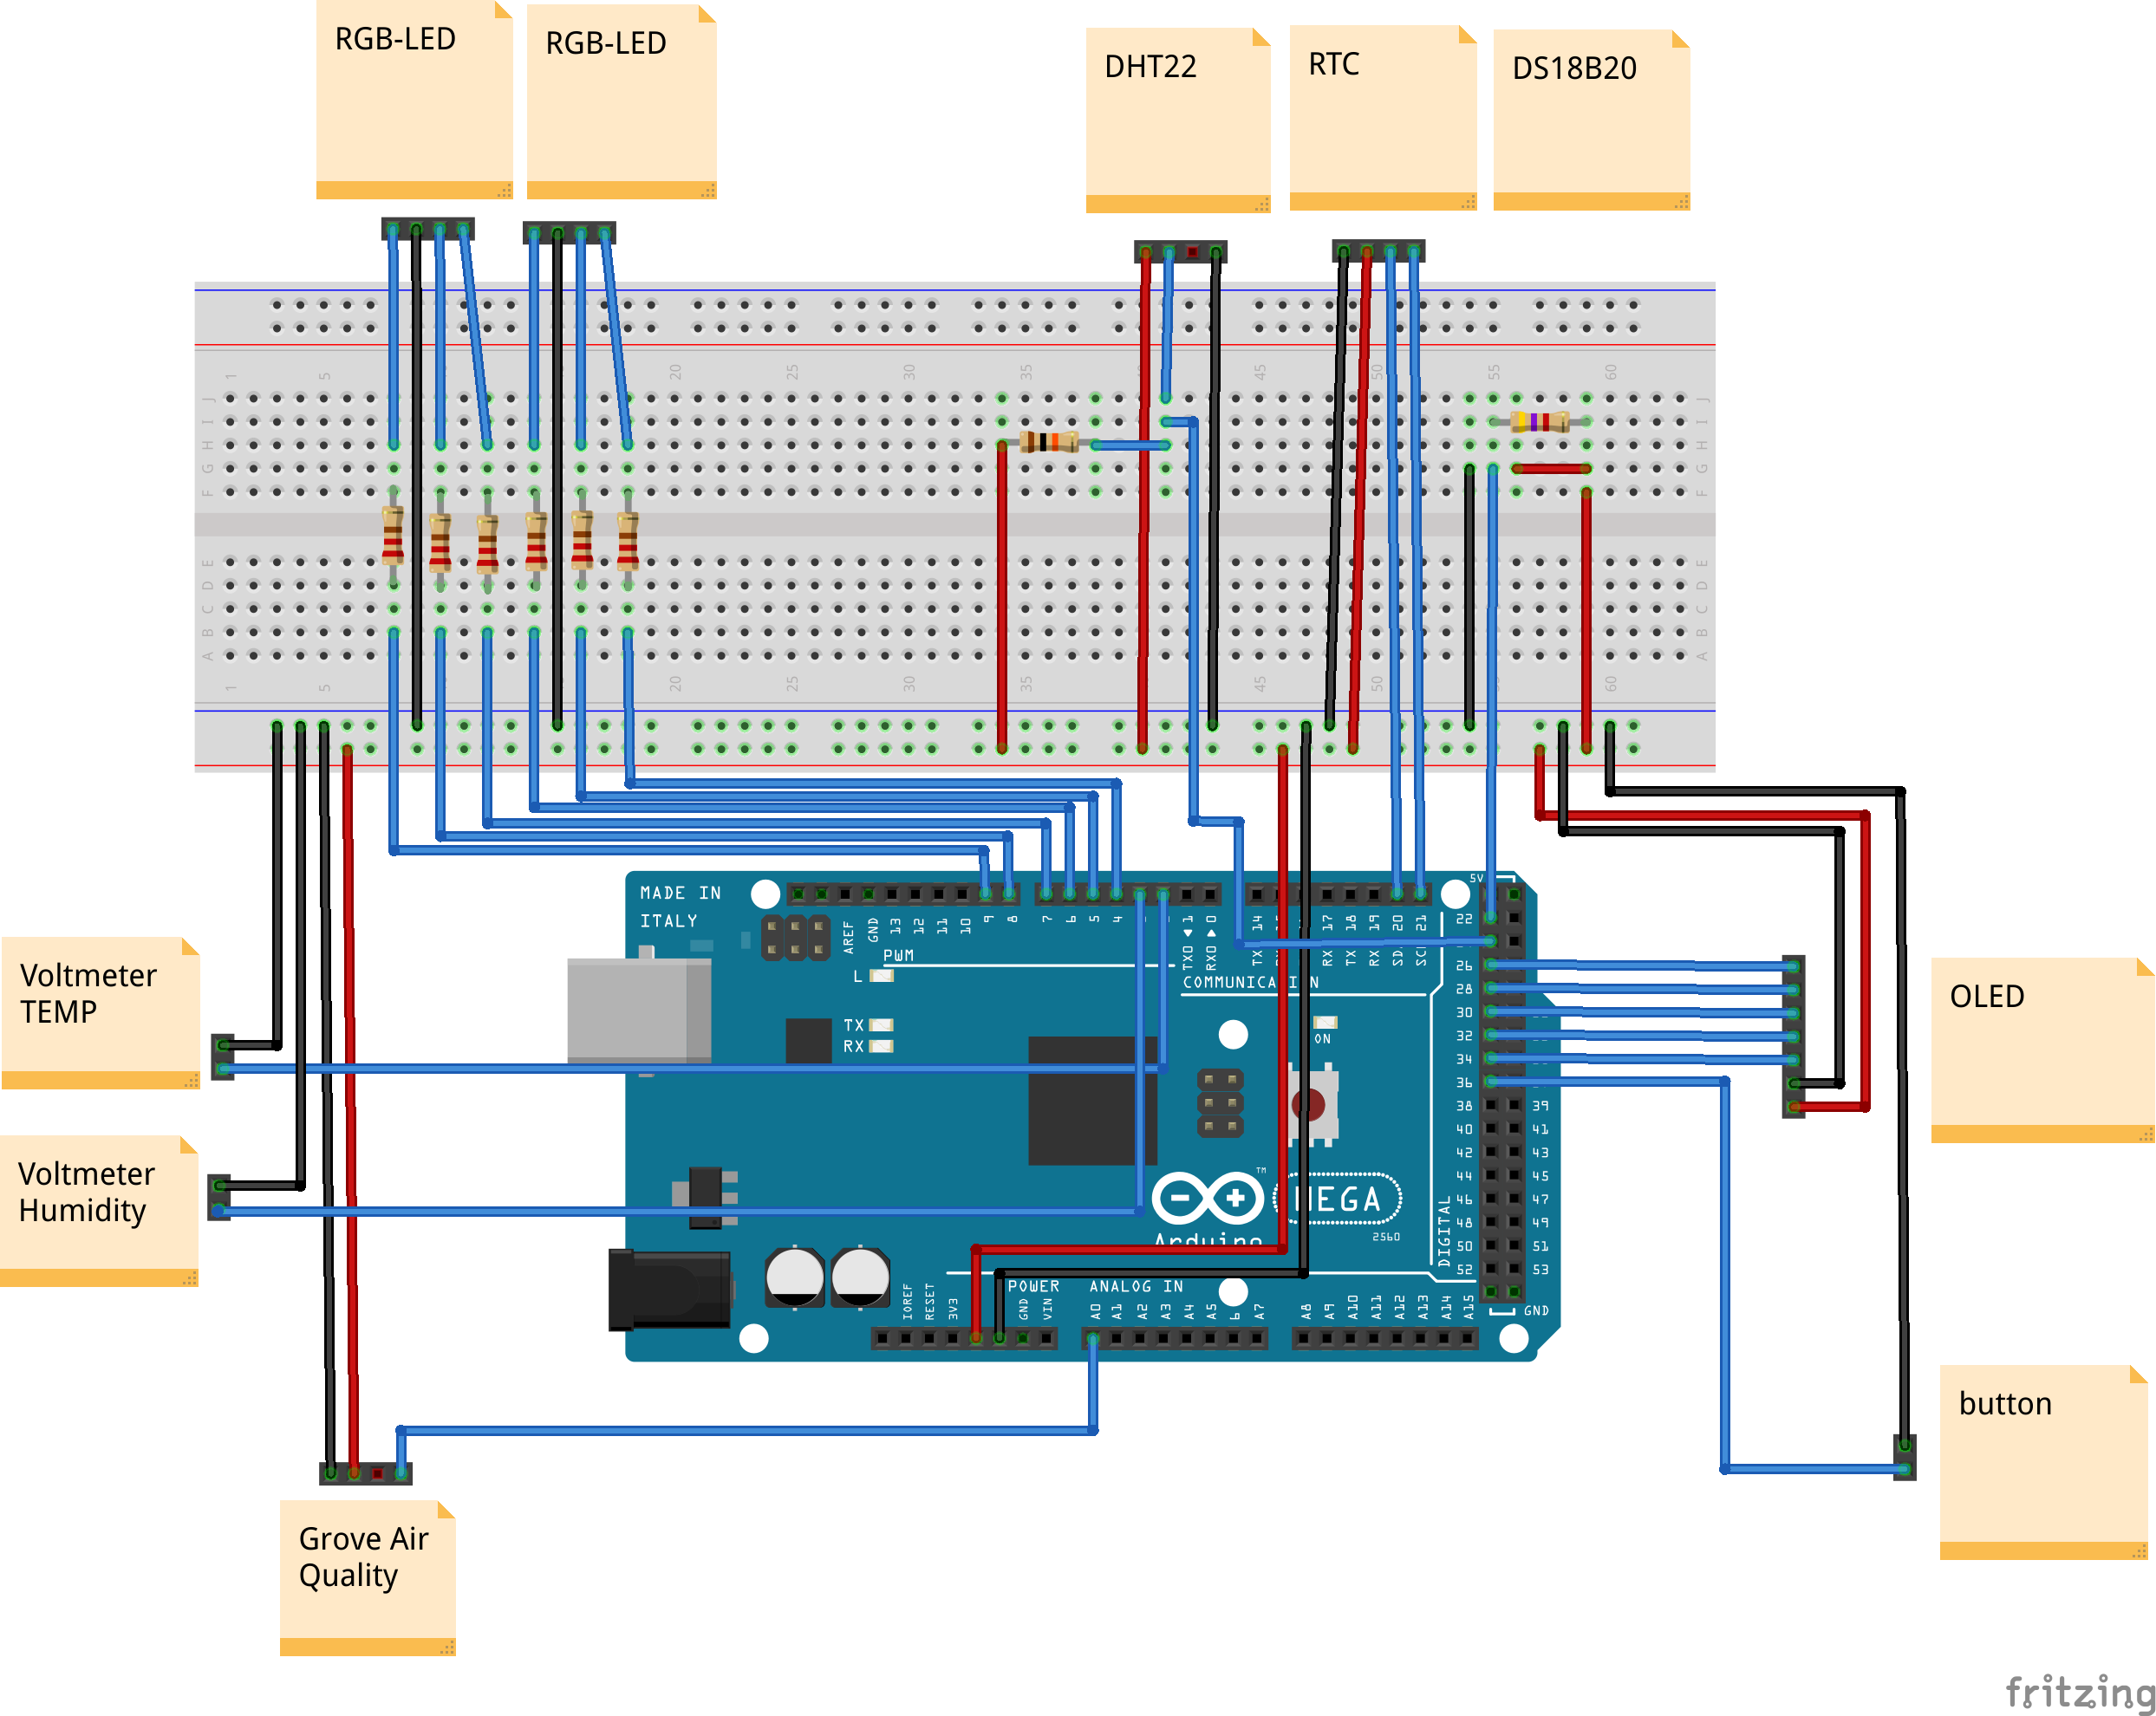
- Arduino Mega 2560: The "brain" of the project, managing multi-directional sensor sampling and coordinating the OLED and meter sync.
- Grove Air Quality v1.3: Providing high-precision and reliable atmospheric data.
- Vintage Voltmeters: Providing high-capacity and reliable physical interface for a retro-modern aesthetic.
- DS18B20 Probe: Essential for providing clear and energy-efficient temperature sensing for external calibration.
- Custom 3D-Printed Case: Provides a clear and professional physical interface and protects the internal circuitry.
- Micro-USB Cable: Used to program the Arduino and provides the primary power source for the digital climate controller.
Casings:
- front side
- back side
PCB:
- Gerber
Voltmeter display
- vector graphics editor
The colours are defined by the laser cutter - red for cutting, black for engraving. The translation of the German expression "Temperatur / Luftfeuchte" is "temperature / humidity". These graphics were printed on a 0.6mm thick laserply.
Climate Monitoring and Interaction Step-by-Step
The air quality monitoring process is designed to be very efficient:
- Initialize Workspace: Correctly seat your sensors inside the 3D-printed case and connect them to your Mega pins properly.
- Setup High-Power Sync: In the Arduino sketch, initialize the
OLEDandDHTlibraries and define the PWM range for the voltmeters in thesetup()function. - Internal Dialogue Loop: The station constantly performs high-performance environmental checks and updates the needle positions in real-time based on your room quality.
- Visual and Data Feedback Integration: Watch your custom dashboard automatically become a rhythmic status signal, pulsing and following your climate settings from a distance.
Future Expansion
- OLED Identity Dashboard Integration: Add a small OLED display to the wall-box to show "NTP Network Time" or "WiFi Signal Strength."
- Multi-sensor Climate Sync Synchronization: Connect a specialized "Dust Sensor" to perform higher-precision "Air Filter Alerts" wirelessly.
- Cloud Interface Registration Support Synchronization: Add a specialized web-dashboard on a smartphone over WiFi/BT to precisely track and log total temperature history curves.
- Advanced Velocity Profile Customization Support: Add specialized "External Probe (vCore)" to the code to allow the system to track outside temperature automatically for differential cooling!
Improvements for the next version
- Not place the temperature sensor on the board - the heat generated by the Arduino will falsify the temperature measurement
- Increase the ventilation slots in the case
[!TIP] To avoid sensor thermal interference, ensure you mount the DHT22 sensor away from the Arduino Mega chip or use an external probe link!
it's getting hotter is a perfect project for any science enthusiast looking for a more interactive and engaging environmental tool!