When you need to see what is happening on your project, but may not be able to stay by the PC waiting for the event you need to see, you need the Web Debugging interface detailed below...
Just set up the Serial Debugger, and run the portable application to allow your board to be accessed via any Web Enabled device, locally or remotely, by more than one person if desired.
You can also take the board and application to another PC, so you can share your project with friends, or show your findings to colleagues in the office, as well as allowing remote access to your machine if you are working remotely.
Setup
The setup is the same as the Serial Debugger from a code perspective, and for build / upload.
Additionally: Enable the vMicro > Debugging > Export Web Debugger (Experimental) option
Build and upload your code to your board as normal
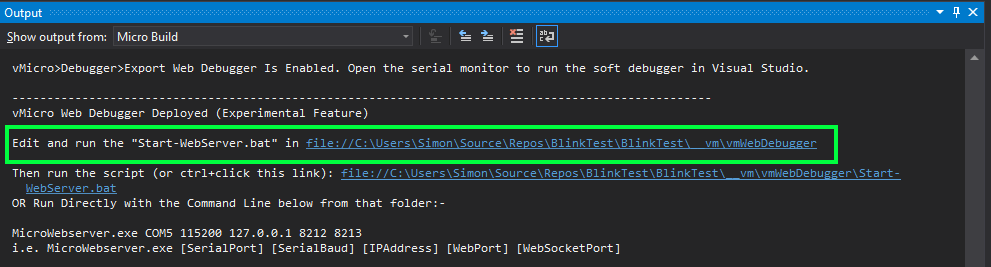
Additional links will be shown in the output, allowing further customisation of the debugger ports and addresses to serve on.
Run the script to kick off the web server, and launch a copy in a browser on your PC.
An Example Video is below, and more detailed instructions can be found on the Visual Micro Website here.
Going Further
This tool is constantly being amended and updated, and new versions will update to Visual Micro customers as soon as they are available.
New Features such as custom dashboards, charts, and more will all be available shortly, so check back for further updates here and on our site:
Export Web Debugger (Experimental)
EXPANDED TECHNICAL DETAILS
Cross-Platform Remote Diagnostics Tool
This advanced project transforms an Arduino into a "Wireless Diagnostic Bridge," allowing developers to debug their hardware using any device with a web browser.
- Visual Micro Integration: Created using the Visual Micro extension for Visual Studio, allowing for "Professional Grade" C++ development and high-speed firmware optimization.
- HTTP/WebSocket Debugging Stream: The Arduino (ESP8266/ESP32) acts as a local access point. It harvests serial logs from a target device and streams them to a beautiful, browser-based terminal dashboard.
Performance
- Zero-Lag Telemetry: Optimized to provide a real-time view of variables and memory usage, helping developers identify bugs in the field without needing a dedicated PC or physical debugger cables.