Project Overview
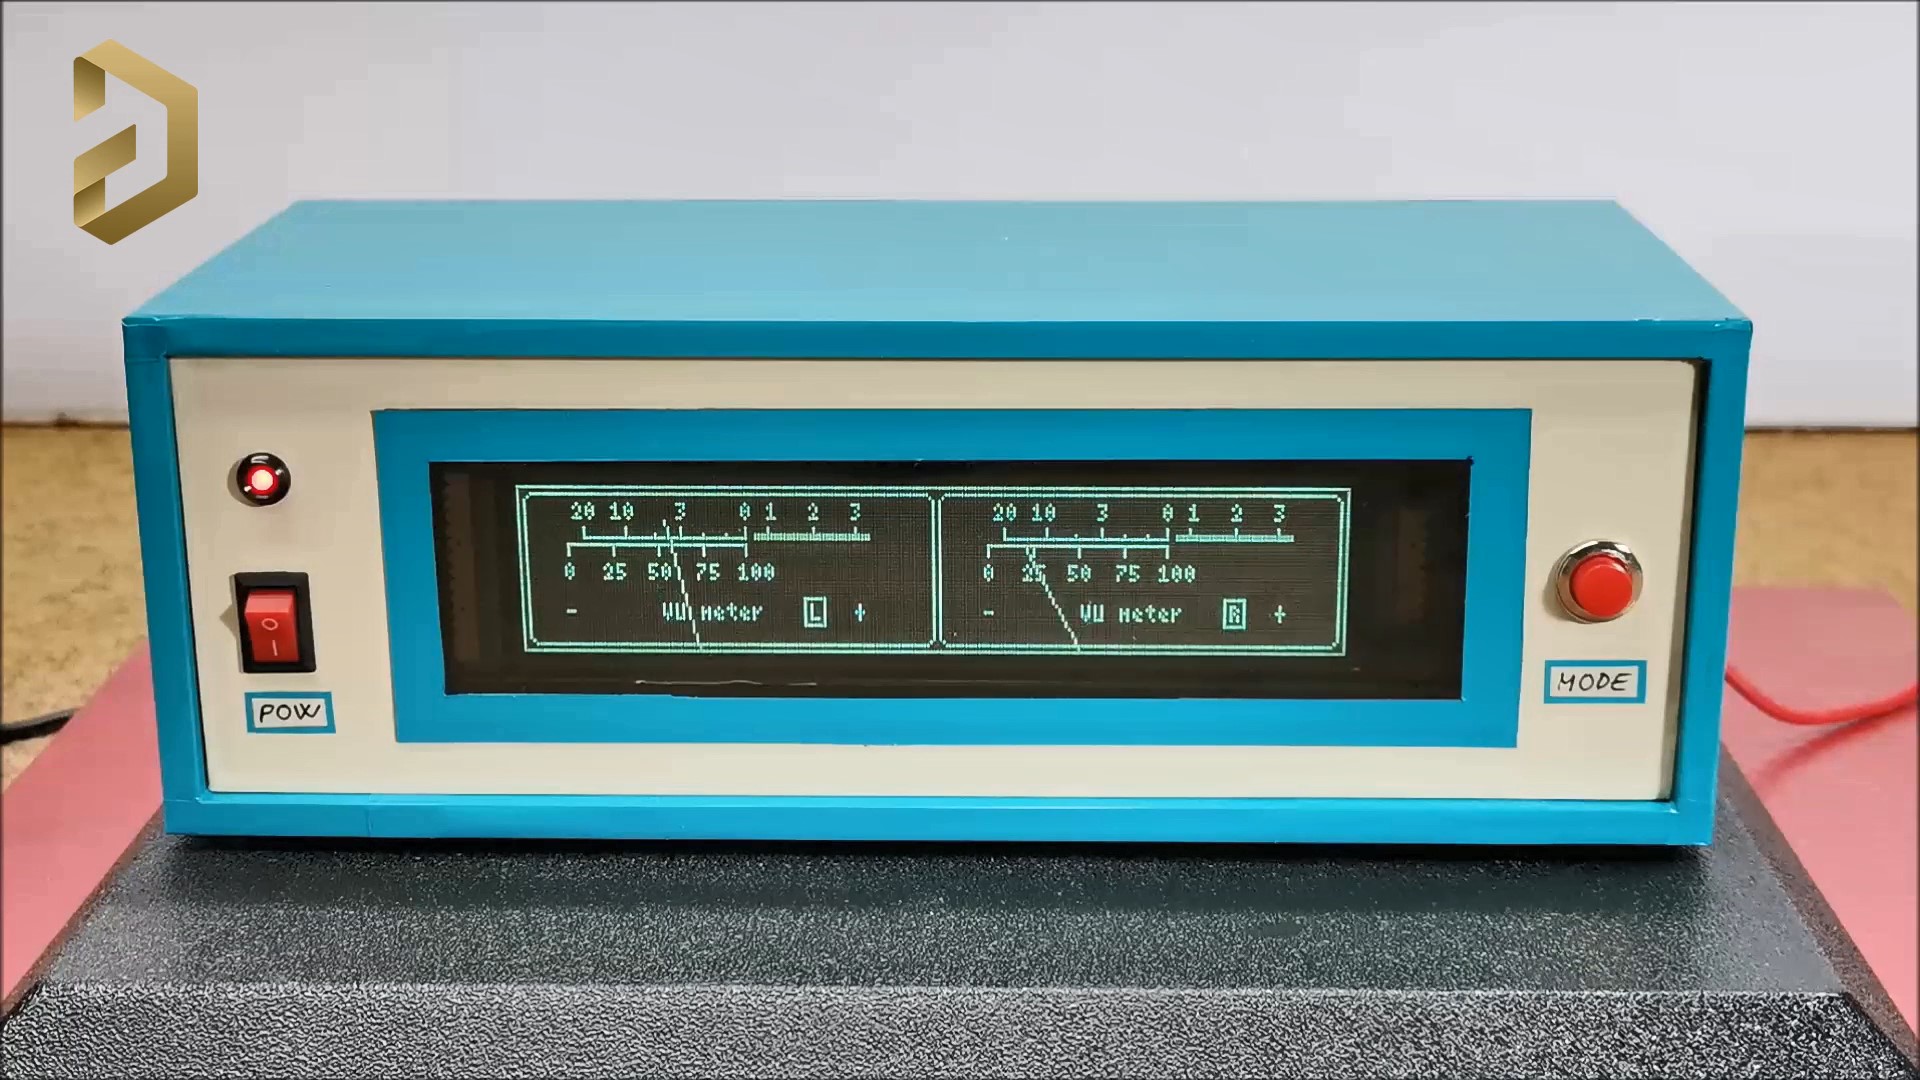
The "Retro VFD Analog VU Meter" is a sophisticated aesthetic project that blends vintage display technology with modern digital control. By utilizing a GP1287 Vacuum Fluorescent Display (VFD), the project emulates the iconic look of 1970s hi-fi equipment while benefiting from the precision of an Arduino Nano. Unlike mechanical needle meters which are prone to wear and physical overshoot, this digital implementation uses a high-resolution dot matrix (256x50) to render smooth, responsive "virtual" needles. The project is an excellent study in analog-to-digital signal processing and high-voltage display interfacing.
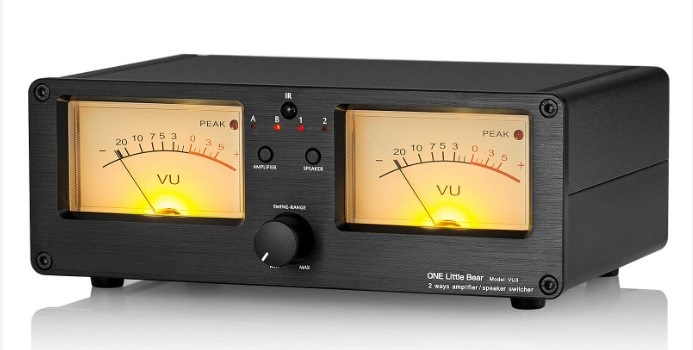
A VU meter, also known as a Volume Unit meter, is a device used to display the audio signal level in decibels (dB) in real-time. It is commonly found on audio equipment to help users monitor and control audio levels. The analog VU meter typically consists needle-based indicators that move in response to the audio signal's intensity
This time I will describe how to make such a device that uses a VFD (vacuum fluorescent display) instead of analog instruments.
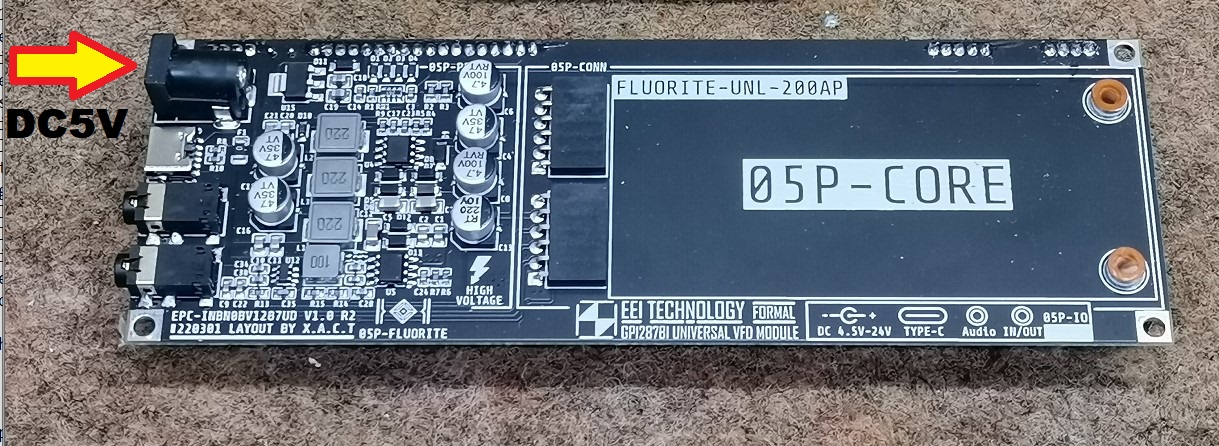
In this particular case, the display is a GP1287 with a resolution of 256 by 50 points, and it can be obtained at a relatively cheap price. In one of my previous videos (https://www.youtube.com/watch?v=nvs09OfKzgc&t=18s) I described how to connect such a display to an ESP32 microcontroller, and this time the display is controlled by Arduino.
The device is extremely simple to build and contains only a few components
- Arduino Nano Microcontroller
- GP1287 VFD Display
- 10K potentiometer,
- and two capacitors and resistors
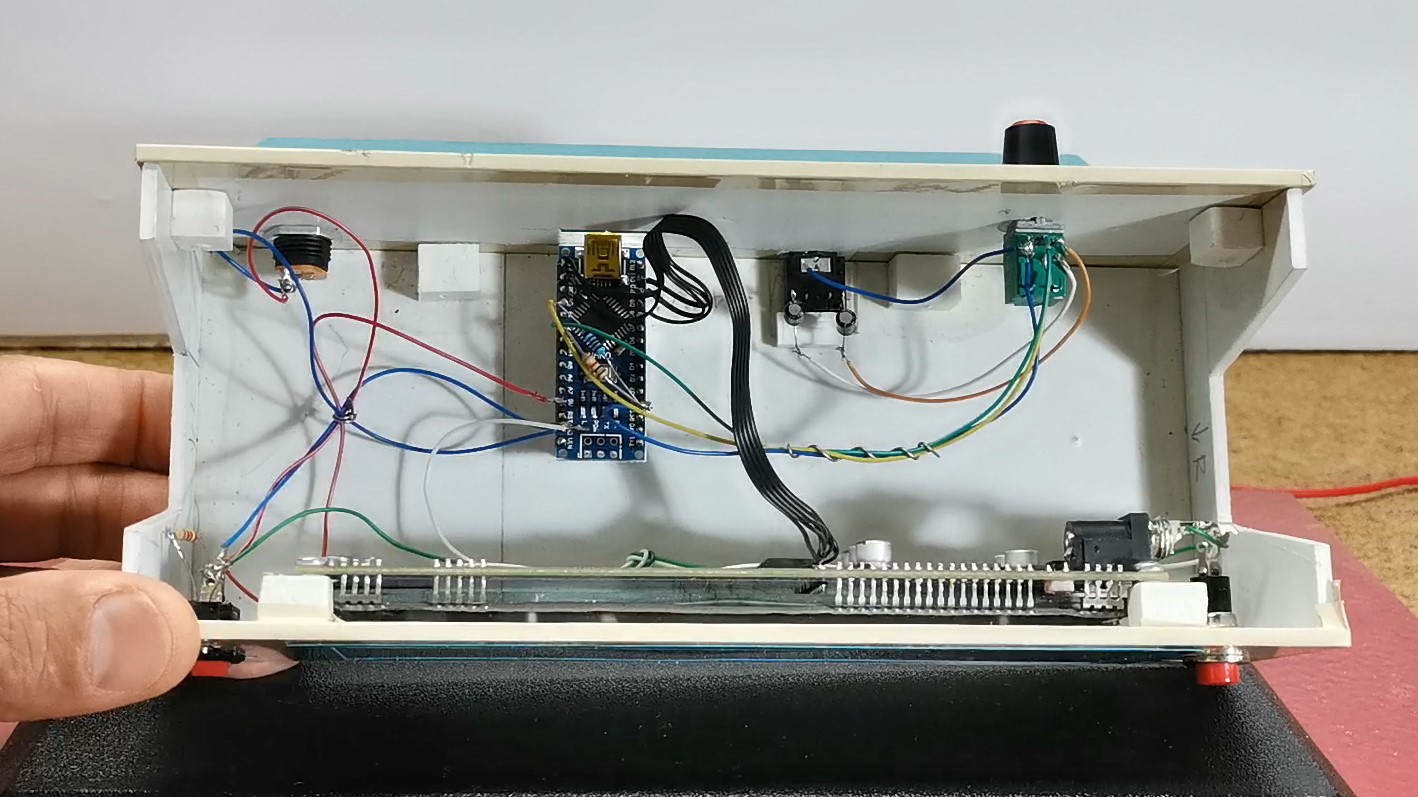
The signal from both audio channels (left and right) is brought to the analog inputs of the Arduino through coupling capacitors.
As for the code, I don't have much experience, so feel free to modify and improve it. It is basically based on the U8G2 library, because only this library has support for this kind of VFD display. Also note that when compiling the code you should use the U8G2 library given below. In the first few lines of code we can define the values of Gain, low sound, High Sound, as well as the speed at which the arrow returns to its original position. The sensitivity of the VU meter can be controlled with the potentiometer mounted on the back of the device.
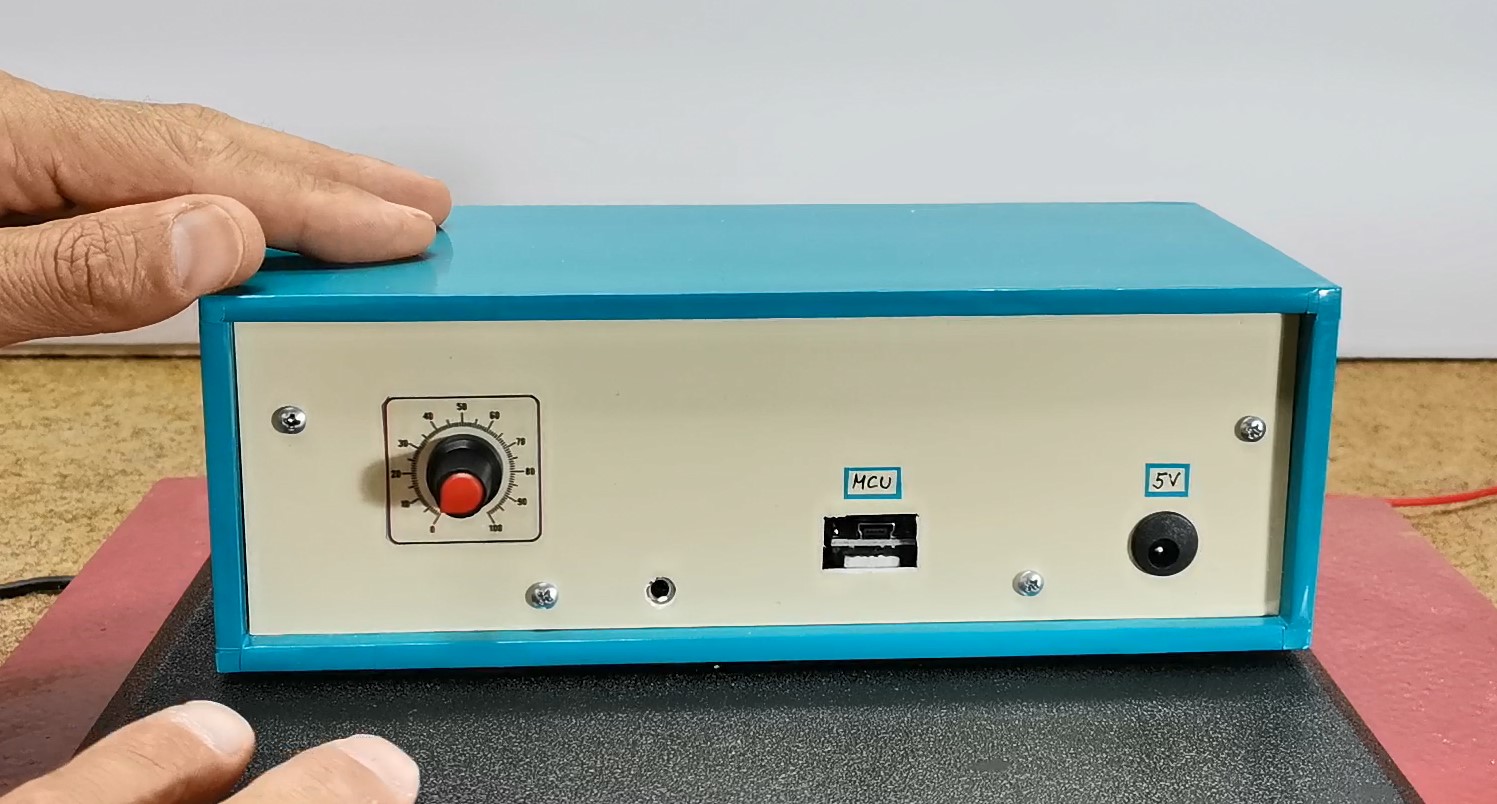
Finally, a short conclusion. I made the device with the intention of explaining to you how you can connect this type of display to an Arduino microcontroller. In actual operation of the VU meter, the slow response of the hands in relation to the input audio signal can be observed, which is a consequence of the display itself, not the microcontroller or the code. Namely, when testing the code I used a 128х64 LCD display instead of a VFD, and the reaction was almost momentary. Due to the relatively high consumption of the display, it is preferable to power it through the power connector of the display itself, which is shown in the picture.
The device is installed in a suitable box made of PVC material with a thickness of 5 mm and covered with colored self-adhesive wallpaper.
Technical Deep-Dive
- VFD vs. LCD Technology: Unlike LCDs which work by blocking light (subtractive), a Vacuum Fluorescent Display works similarly to a cathode-ray tube. It contains a heated filament (cathode) that emits electrons, which are then attracted to phosphor-coated anodes. This gives VFDs their characteristic high-contrast, self-emissive teal glow. Electrically, VFDs require a higher voltage (often 12V-24V for the anodes) and a small AC/DC voltage for the filament, which the GP1287 module typically handles via its own integrated power circuitry.
- Analog Frontend & Audio Coupling: The audio signal is an AC waveform that swings both positive and negative. Since Arduino's analog pins can only read 0V to 5V, this project uses coupling capacitors (10uF) to "block" the DC component of the source and a voltage divider circuit (using 2x 10k resistors) to "bias" the signal at 2.5V (the DC rail's midpoint). This allows the Arduino to capture the full audio wave without clipping the negative half-cycles.
- U8G2 Library & Graphic Rendering: The
U8G2library is used to handle the SPI/Parallel communication with the VFD controller. Rendering the needles involves basic trigonometry: calculating the end coordinates $(x, y)$ of a line where: $x = \text{centerX} + \text{Radius} \cdot \cos(\text{angle})$ $y = \text{centerY} + \text{Radius} \cdot \sin(\text{angle})$ The "angle" is mapped directly from the peak-to-peak amplitude of the audio signal sampled byanalogRead(). - Software Ballistics: To achieve an "analog feel," the code implements fall-off ballistics. When a loud peak is detected, the needle jumps instantly. To prevent it from flickering back too fast, the software uses a decay constant (defined in the code's Gain/Speed variables), simulating the physical mass and momentum of a real needle.