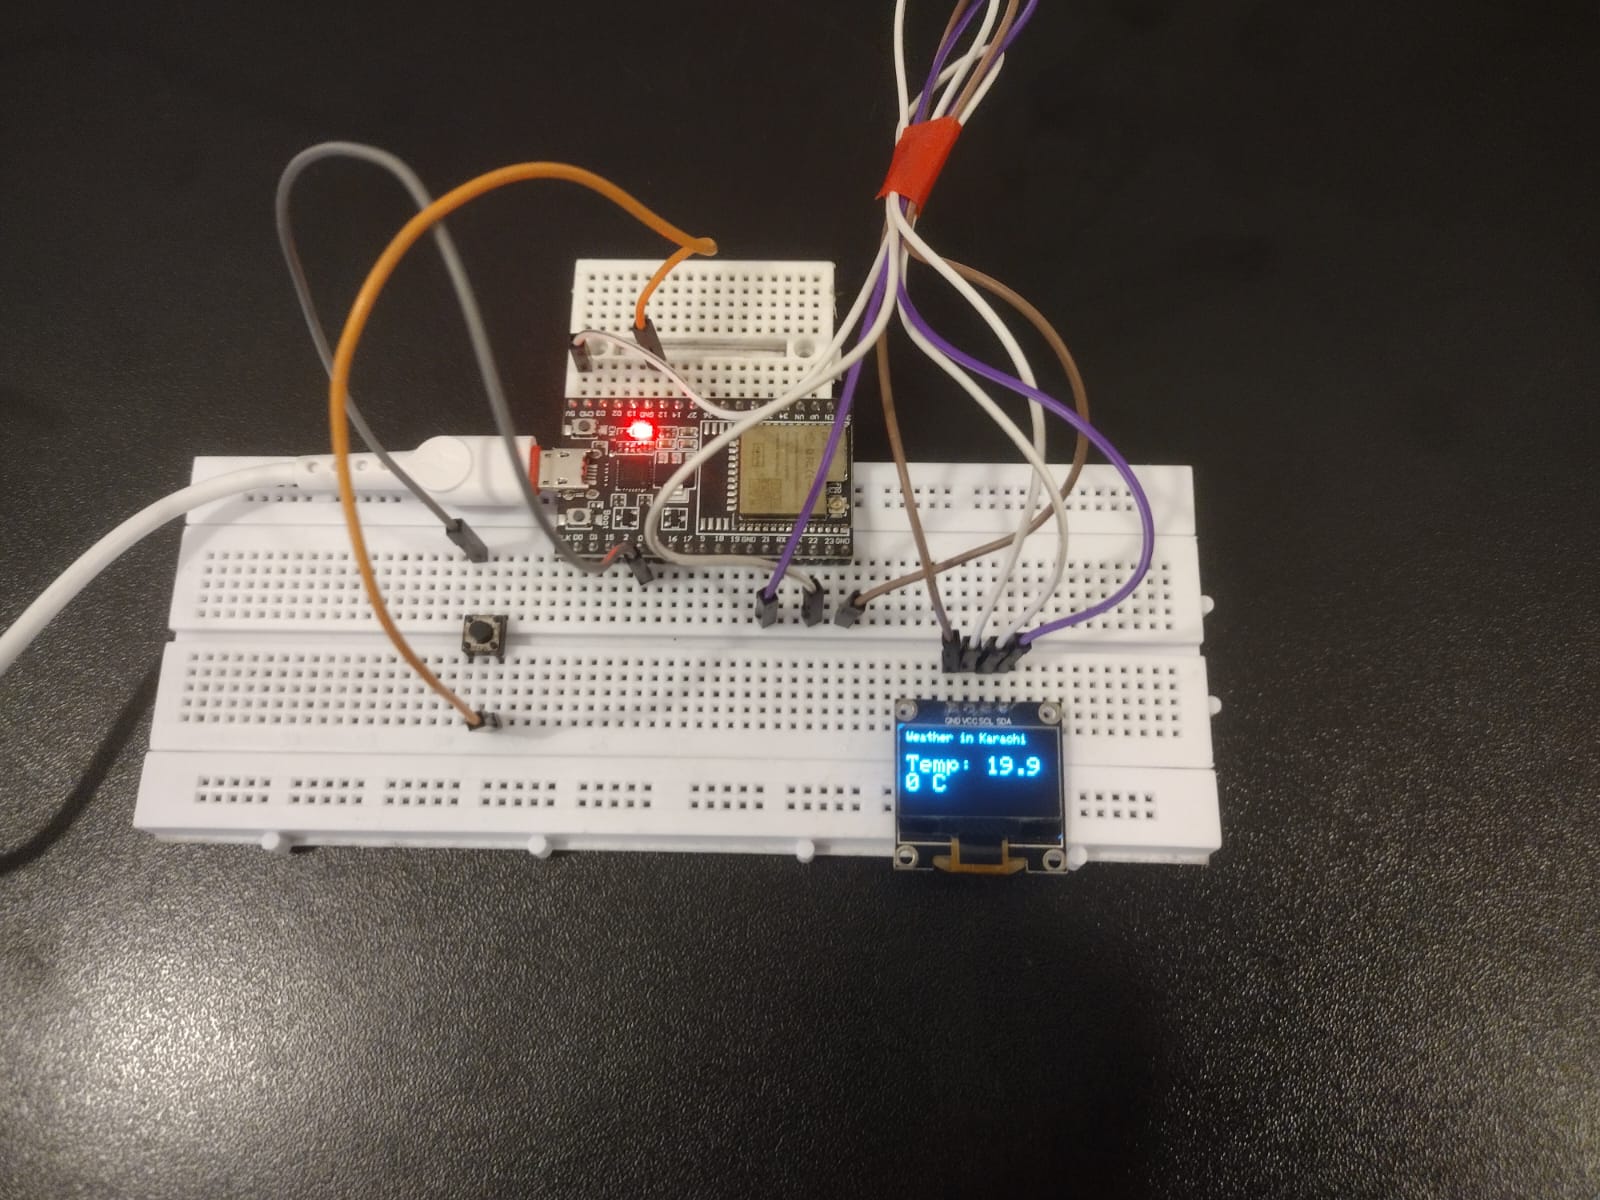
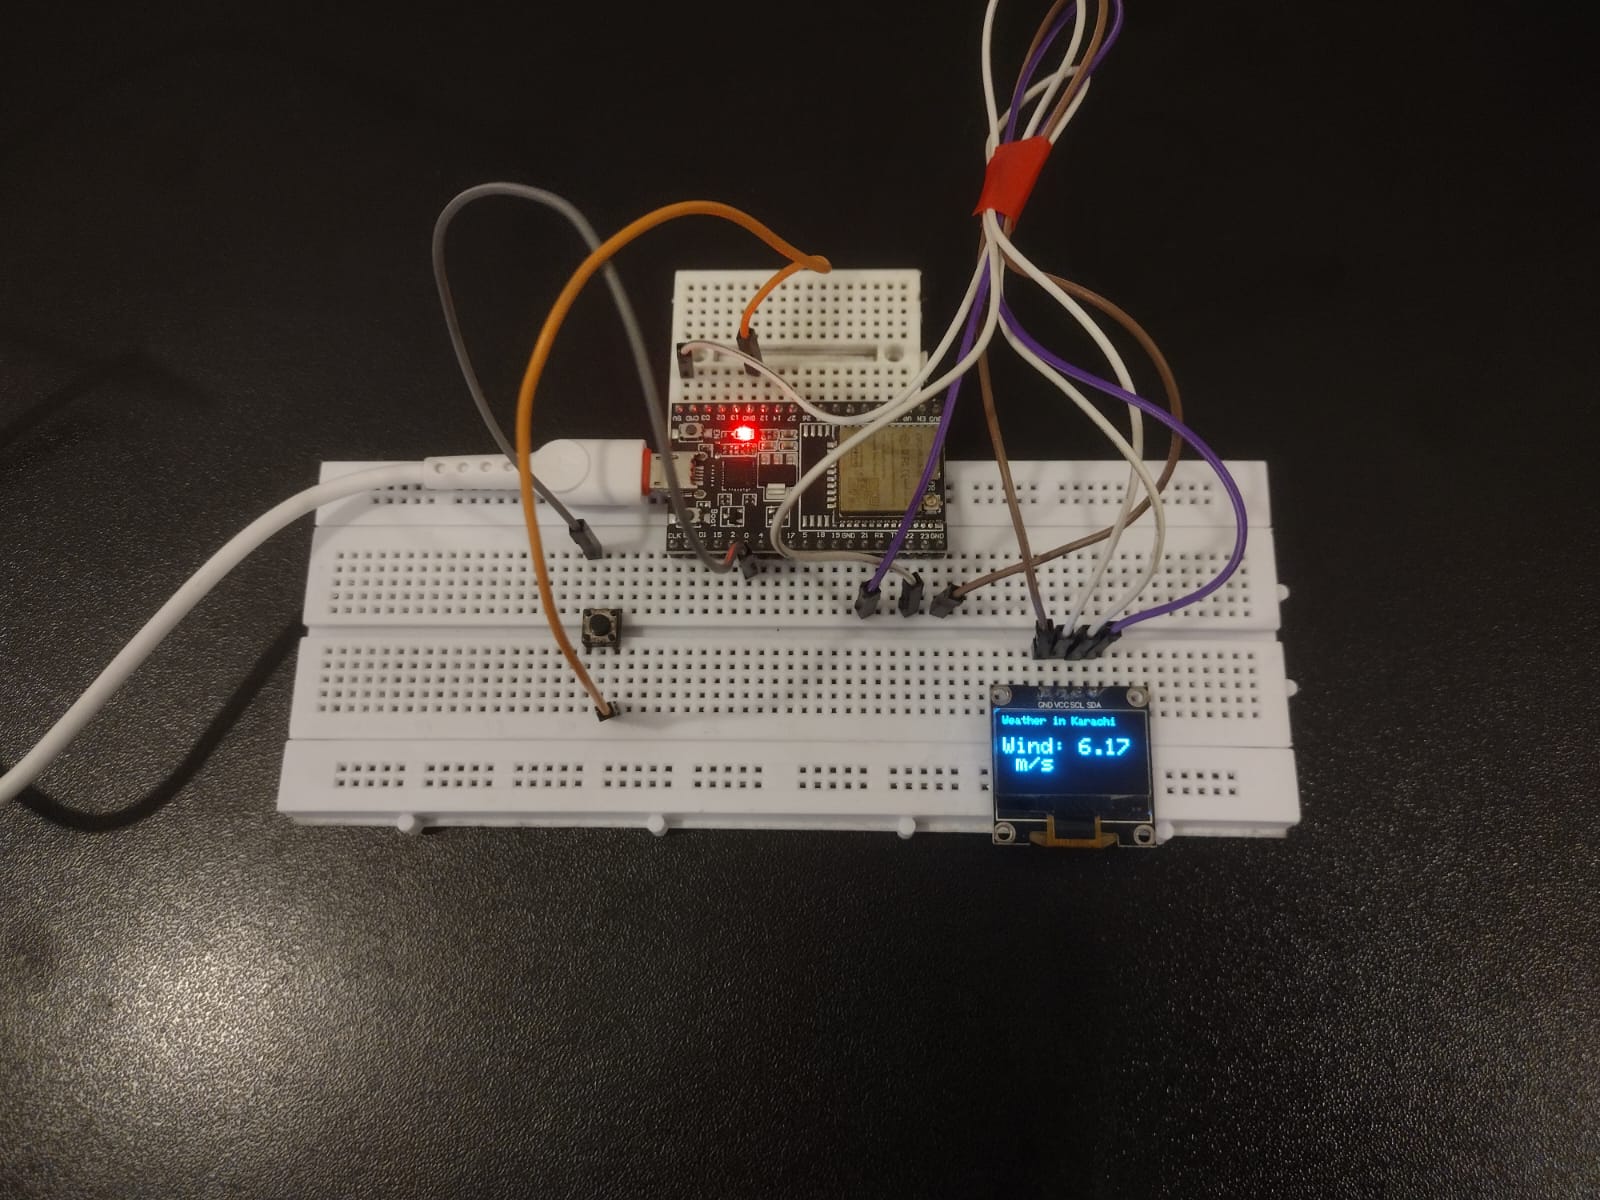
This project shows how to use the ESP32/ESP8266 and an SSD1306 OLED display in order to display real-time weather condition from the OpenWeatherMap API. This system is able to present weather parameters, like temperature, humidity and wind velocity of Karachi, and cycle through these parameters with the push of a button.
Features:
- Wi-Fi Connectivity to obtain real-time weather data.
- Information on the Weather will be displayed on the OLED via 3 different modes: Temperature, Humidity, and Wind Speed.
- One Button shall be used to switch between modes.
- New information will be updated automatically every 10 minutes.
Components:
- ESP32/ESP8266 Based microcontroller.
- SSD1306 OLED Based Display.
- Switching for Button.
- OpenWeatherMap API for fetching the weather information.
IoT Weather Architecture Overview
The Smart Weather Monitor functions through a specialized Request-Parse-Display lifecycle. Operating on the ESP32 Dual-Core processor, the device initiates a secure WiFi handshake to access the OpenWeatherMap API. It transmits a location-specific GET request, receives a complex JSON payload, and utilizes high-speed parsing to extract precise telemetry for temperature (feels-like), humidity (absolute), and wind velocity. This data is then formatted for the high-contrast SSD1306 OLED interface.
Hardware Infrastructure & The Connectivity Tier
- ESP32 NodeMCU / Nano ESP32: The "Connectivity Engine." Chosen for its integrated WiFi/Bluetooth stack and ample SRAM, which allows for large JSON buffers that would overwhelm a standard Arduino Uno.
- SSD1306 OLED (128x64): The "Status Panel." It uses the I2C protocol (SDA/SCL) for a 2-wire setup. The monochrome display ensures that weather data is crisp and readable from any angle in any lighting condition.
- Mode-Selection Button: A critical UX element. Instead of cluttering the small screen with all data at once, the physical button allows the user to cycle through three "High-Density Views":
- Thermal View: Real-time temperature (°C/°F).
- Atmospheric View: Relative humidity percentage.
- Aerodynamic View: Wind speed (m/s) and gusts.
- Dual-Bus Logic: The project demonstrates the importance of separating the Power Rail from the I2C Data Bus to ensure that WiFi signal spikes don't cause screen flickering or data corruption.
Technological Logic and The API Handshake
The system reaches high-latency reliability through several Software Protocol Strategies:
- JSON Stream Parsing: Because the OpenWeatherMap payload can be larger than 512 bytes, the code uses the
ArduinoJsonlibrary to "Filter" the incoming stream, only keeping the specific weather keys required and discarding the rest to save memory. - State-Cycling Interrupts: The button is tied to a "State Counter." Every press increments a variable (0, 1, 2) which the main loop uses to switch between visual dashboards.
- Automatic Refresh Protocol: To avoid hitting API rate limits while keeping data fresh, the system uses a non-blocking
millis()timer. It refreshes the data every 600,000 milliseconds (10 minutes) without pausing the screen interaction. - Weather Icons & Graphics: The project utilizes the
Adafruit_GFXlibrary to draw custom weather icons (clouds, sun, wind streaks), providing a premium look rather than just plain text.
WORKING
Get your API key from https://openweathermap.org and paste it in the code. Enter your wifi credentials. Upload the code.
MAKE SURE TO CHANGE THE LOCATION TO YOUR DESIRED LOCATION INSTEAD OF "KARACHI" AS IN THIS CODE.
Why This Project is Important
Mastering WiFi Serial Communication and API Integration is an essential skill for Full-Stack IoT Developers and Smart City Engineers. It teaches you how to bridge the physical world of microcontrollers with the digital world of global databases. Beyond weather monitors, these same principles are used in Industrial Stock-Ticker Displays, Real-Time Logistics Monitors, and Smart Grid Energy Dashboards. Building this project proves you can handle secure internet protocols and deliver high-value data to a compact, user-friendly interface.