The need for a clever plotter
Arduino can be used as a data acquisition system in scientific application, where you want to store data on files for further processing, and look at plots online. The Arduino IDE's Serial Plotter is quite limited: you have little control of what is going to be shown. With the Arduino Clever Plotter (ACP) you can plot data as usual, but you can control what is shown on the x-axis and the limits of the y-axis. You can assign meaningful names to graphs and choose the best representation. The ACP stores data on files, too.
For the impatient
- Download the application from here
- Upload a sketch on you preferred Arduino board, such that it outputs data as a list of comma separated values
- Run the ACP
Below, an example of what you can see when collecting data from an experiment in which you measure the voltage across a capacitor in an RC circuit
Preparing your Arduino sketch
The ACP can run similarly to the IDE's Serial Plotter. If you just print out a single value, as
Serial.println(mydata)
then the ACP will plot data as a function of the number of loops. If you print more than one value, separated by commas, such as
Serial.print(x_data);
Serial.print(",");
Serial.print(y_data);
Serial.print(",");
Serial.println(z_data);
then, the ACP will make three graphs on the same plot, as shown below:
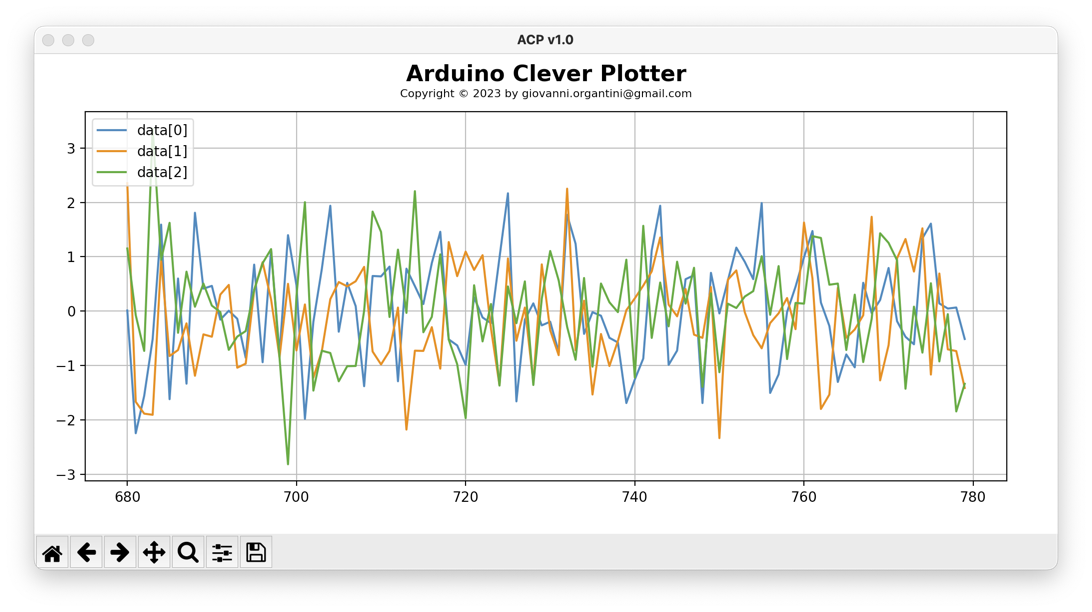
Each graph is automatically labelled and a legend appears on the top left corner. The x-axis corresponds to the number of loops.
It is worth noting that, if no Arduino is found, the ACP will simulate its presence writing random data on the port.
If you want to plot data as a function of another quantity collected during the run, you can declare it as such in the setup() function, writing an XML structure to the serial port as
Serial.println("<header><x>t [$\\mu$s]</x></header>");
When the ACP detects this string, it interprets the first number found in the comma separated list as the variable to be plotted on the x-axis. The axis is also labelled after the content of the <x> tag. In the example, as "t [𝜇s]" ($\\mu$ is rendered as a 𝜇).
You can label the data on the y-axis adding the corresponding labels. For example:
Serial.println("<header><x>t [$\\mu$s]</x><y>V_C [V]</y></header>");
If there are more data to plot in the comma separated list, you just provide a comma separated list of labels in the XML in the <y> tag:
Serial.println("<header><x>t [$\\mu$s]</x><y>V_C [V],V_R [V]</y></header>");
The y-scale is automatically adjusted to make room for the plot. If you want to fix it, just add the lower and/or the upper values, using the <ylim> tag:
Serial.println("<header><x>t [$\\mu$s]</x><y>V_C [V]</y><ylim>0,None</ylim></header>");
or
Serial.println("<header><x>t [$\\mu$s]</x><y>V_C [V]</y><ylim>0,1023</ylim></header>");
or, again,
Serial.println("<header><x>t [$\\mu$s]</x><y>V_C [V]</y><ylim>None,10</ylim></header>");
The ACP automatically store data in a CSV file called acp.csv by default. This way you can analyse data offline, if needed.
Technical Architecture & Serial Protocol
- Python Backend: The ACP is written in Python, leveraging powerful libraries like
matplotlibfor high-quality rendering andpyserialfor low-level communication with the hardware. This allows for features like LaTeX rendering for axis labels (e.g., using$\mu$for micro-units). - XML Metadata Handshake: ACP introduces a clever metadata protocol. By sending a specific string like
<header><x>t [$\mu$s]</x><y>V_C [V]</y></header>duringsetup(), the user can dynamically configure the plotter's GUI from the Arduino code itself. This "self-describing" data stream is a common pattern in advanced industrial IoT protocols. - Zero-Jitter Logging: While plotting in real-time is vital, ACP also simultaneously pipes all incoming serial packets to a CSV file (
acp.csv). This ensures that even if the computer's rendering thread lags, the data integrity is maintained for post-processing in tools like Excel, MATLAB, or Python's Pandas. - Virtual Hardware Simulation: ACP includes a robust simulation mode (
-sand-pswitches). If no Arduino is detected, the script generates synthetic data (random noise or mathematical curves), allowing developers to test their visualization logic and Python environment without needing physical hardware connected.
Controlling the application
The ACP starts just launching acp.py. No arguments are required. The -h switch provides some help
> python3 acp.py -h
You can choose te port to read data from using the -p switch. The filename where data are stored is, by default, acp.csv, but you can change it with the -f switch.
If no Arduino board is found, the ACP will simulate its presence. You can simulate the dispatch of the header with the -s switch. In this case data are labelled as "x (m)", "y (m/s$^2$)" and "z (kg)". To add a simulated x-column, just add a -t switch to the acp.py command.
The ACP runs forever, unless you use the switch -n telling how many loops to collect. When the number of rows read from Arduino is equal to this number, the ACP stops and wait for you to close the plot window.
The x-axis shows, by default, the last 100 numbers collected. You can change this number with the -r switch.
The -m switch let you choose a different maker for data. Just use the format of the matplotlib.pyplot library. For example "-m o-" represents data with small circles connected by a line.
The -b switch is used to set the baud rate (default is 9600). ACP becomes verbose if the -v switch is on.
Engineering & Usage
- Dynamic Scaling: Using the
<ylim>tag, engineers can prevent the common Serial Plotter issue where a small noise spike zooms the graph out, hiding the actual signal. Setting limits like0, 1023(for a 10-bit ADC) keeps the visual context stable. - Command Line Flexibility: The tool is designed for "power users" with CLI flags for baud rate control (
-b), port selection (-p), and rolling-window size (-r), which determines how many historical data points are visible on the screen at once. - Marker Customization: Through the
-mswitch, users can choose between line plots, scatter plots, or combined markers, facilitating the identification of discrete data samples versus continuous waveforms.
Licensing
The ACP is licensed after the GNU General Public License version 3. For further details run the script with the switch -l.