ชื่อโปรเจกต์: Arduino & Python3 Temperature Data Visualizer
นี่คือโปรเจกต์ที่เรียบง่ายมาก ๆ โดยเราจะใช้ NTC thermistor เป็นตัวจับอุณหภูมิ, Arduino เพื่อรับค่าความต้านทานของ NTC thermistor และแปลงเป็นข้อมูลอุณหภูมิที่ถูกต้อง จากนั้นส่งไปยังคอมพิวเตอร์ผ่าน serial ซึ่งเราสามารถจัดเก็บและแสดงผลข้อมูลนั้นได้ นอกจากนี้ เราจะใช้ LCD เพื่อแสดงอุณหภูมิด้วย
รายละเอียดบางส่วน
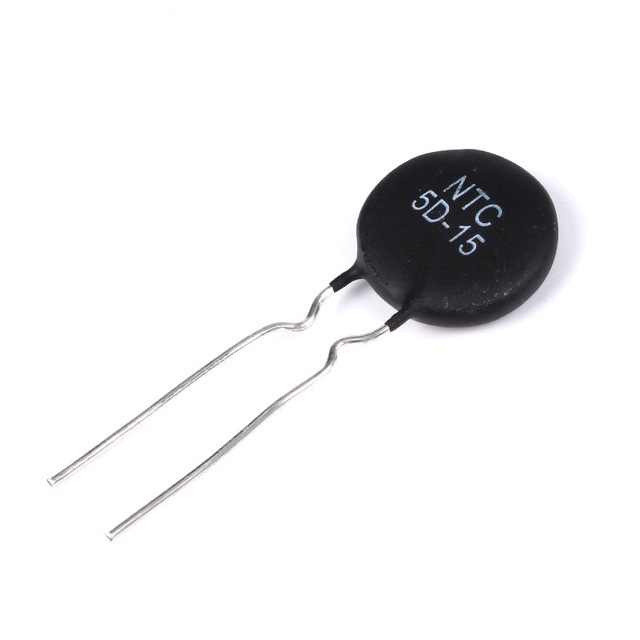
NTC thermistor คือตัวต้านทานแบบปรับค่าได้ที่เปลี่ยนค่าไปตามอุณหภูมิ, NTC ย่อมาจาก negative temperature coefficient ซึ่งหมายความว่าค่าความต้านทานจะลดลงเมื่ออุณหภูมิสูงขึ้น และจากฟังก์ชันที่กำหนดนี้:

R0 : คือค่าความต้านทานเมื่ออุณหภูมิเท่ากับ T0
B : คือค่าคงที่ของ thermistor ที่คุณสามารถหาได้ใน datasheet
เราจะหาความสัมพันธ์ของอุณหภูมิจากค่าความต้านทาน

อุณหภูมิในที่นี้อยู่ในหน่วยเคลวิน (kelvins) และเราจะใช้ฟังก์ชันนี้ในโค้ด Arduino
ตอนนี้ มาดูวิธีการวัดความต้านทานของ thermistor โดยใช้ Arduino และเราจะใช้ วงจรนี้
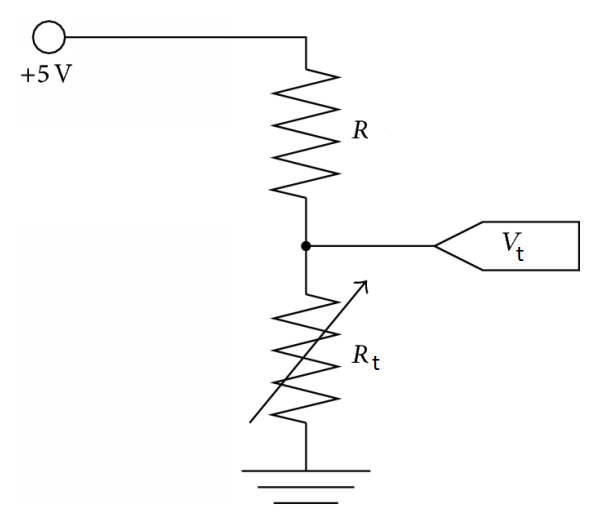
เชื่อมต่อกับแหล่งจ่ายไฟ 5V จาก Arduino โดยที่ R คือ resistor 110 ohm และ thermistor คือ Rt เราจะวัดแรงดันไฟฟ้า Vt ที่ thermistor โดยใช้ขา analog input A0 และจากสูตร voltage divider เราจะหาความสัมพันธ์ของความต้านทาน Rt

วงจร:
- ขา LCD RS ไปที่ขา digital 12
- ขา LCD Enable ไปที่ขา digital 11
- ขา LCD D4 ไปที่ขา digital 5
- ขา LCD D5 ไปที่ขา digital 4
- ขา LCD D6 ไปที่ขา digital 3
- ขา LCD D7 ไปที่ขา digital 2
- ขา LCD R/W ไปที่ ground
- ขา LCD VSS ไปที่ ground
- ขา LCD VCC ไปที่ 5V
- ขา LCD K ไปที่ ground
- ขา LCD A ไปที่ 5V
- ขา LCD V0 ไปที่ขา digital 6 (PWM)
- LED ไปที่ขา 13
ต่อ resistor 110 ohm อนุกรมกับ thermistor โดยให้ด้านหนึ่งของ resistor 110 ohm ต่อกับ 5V, อีกด้านของ thermistor ต่อกับ GND และจุดที่ thermistor กับ resistor เชื่อมต่อกัน ให้ต่อกับ analog input A0:
รายละเอียดทางเทคนิคเพิ่มเติม
ชุดโปรแกรม Telemetry และ Dashboard ข้ามแพลตฟอร์ม
โปรเจกต์นี้สร้างการเชื่อมโยงข้อมูลความเร็วสูงระหว่าง Arduino และ PC โดยใช้ Python 3 เพื่อสร้างแผนภูมิกราฟิกแบบมืออาชีพสำหรับข้อมูลสิ่งแวดล้อม
- PySerial Handshake Hub: ฝั่ง PC, สคริปต์ Python จะเปิดพอร์ต serial และรอรับ data packets ที่จัดรูปแบบตามมาตรฐาน NASA จาก Arduino
- Matplotlib Real-Time Graphing: ใช้ไลบรารี Matplotlib ภายในสภาพแวดล้อม Python IDLE เพื่อสร้างกราฟแบบเลื่อนได้แบบเรียลไทม์สำหรับข้อมูลอุณหภูมิและความชื้น พร้อมด้วยตัวบ่งชี้ค่าต่ำสุด/สูงสุด
ประสิทธิภาพ
- Packet-Check Integrity Logic: Arduino จะเพิ่ม checksum แบบง่ายๆ เข้าไปท้ายสตริงข้อมูลทุกครั้ง; สคริปต์ Python จะตรวจสอบสิ่งนี้ก่อนที่จะพลอต ทำให้มั่นใจว่ากราฟยังคงเสถียรแม้ว่าสาย serial จะถูกขยับ