การบันทึกข้อมูล (Data Logging) เป็นหัวใจสำคัญของการพัฒนาระบบ IoT ในโปรเจคนี้ผมต้องการสร้างระบบที่สามารถตรวจวัดสภาพอากาศด้วย Arduino MKR WIFI 1010 แล้วส่งข้อมูลไปแสดงผลบน Dashboard ที่สวยงามและเข้าถึงได้จากทุกที่ผ่าน Grafana Cloud โดยใช้โปรโตคอล MQTT เป็นตัวกลางในการสื่อสารข้อมูลภายในเครือข่าย
บทความนี้จะเจาะลึกตั้งแต่การเขียนโปรแกรมบน Arduino, การตั้งค่า Middleware บน Raspberry Pi ด้วย Python และการเชื่อมต่อไปยัง Cloud เพื่อให้นักพัฒนาและวิศวกรสามารถนำไปประยุกต์ใช้กับเซนเซอร์รูปแบบอื่นๆ ได้อย่างมืออาชีพ
สถาปัตยกรรมของระบบ (System Architecture)
เพื่อให้เห็นภาพรวม ระบบนี้ประกอบด้วย 3 ส่วนหลัก:
- Edge Device: Arduino MKR WIFI 1010 ทำหน้าที่อ่านค่าจากเซนเซอร์ BME280 และส่งข้อมูลผ่าน MQTT
- Local Gateway: Raspberry Pi (หรือเครื่อง Linux) ทำหน้าที่เป็น MQTT Broker (Mosquitto) และรัน Python Script เพื่อแปลงข้อมูลเข้าสู่ Prometheus
- Visualization: Grafana Cloud รับข้อมูลจาก Prometheus มาสร้างกราฟแบบ Real-time
ส่วนที่ 1: การตั้งค่า Arduino และการส่งข้อมูลผ่าน MQTT
Arduino MKR WIFI 1010 เป็นบอร์ดที่มีโมดูล WiFiNINA ในตัว เหมาะสำหรับการใช้งาน IoT ที่ต้องการความเสถียรสูง ในส่วนนี้เราจะใช้ไลบรารี PubSubClient สำหรับการสื่อสาร MQTT
การประกาศตัวแปรและโครงสร้างข้อมูล
เราต้องกำหนด IP ของ MQTT Broker และ "Topics" ซึ่งเปรียบเสมือนที่อยู่ของข้อมูลแต่ละประเภท เพื่อให้ฝั่งรับแยกแยะได้ว่าค่าที่ส่งมาคืออุณหภูมิหรือความชื้น
#include "PubSubClient.h"
#include <WiFiNINA.h>

// คุณสมบัติของ MQTT
const char* mqtt_server = "192.168.50.100";  // IP Address ของ MQTT Broker (เช่น Raspberry Pi)
const char* temp_topic = "outdoor/weather/temperature";
const char* humid_topic = "outdoor/weather/humidity";
const char* pressure_topic = "outdoor/weather/pressure";
const char* altitude_topic = "outdoor/weather/altitude";
const char* distance_topic = "outdoor/weather/distance";

const char* mqtt_username = MQTT_user; // MQTT Username
const char* mqtt_password = MQTT_pass; // MQTT Password
const char* clientID = "arduino";      // ID ของเครื่อง Client
ฟังก์ชันการเชื่อมต่อ (Connection Logic)
หัวใจสำคัญคือการจัดการสถานะการเชื่อมต่อ ทั้ง WiFi และ MQTT ต้องพร้อมก่อนที่จะส่งข้อมูล
WiFiClient wifiClient;
PubSubClient client(mqtt_server, 1883, wifiClient);

void connect_MQTT(){
  Serial.print("Connecting to ");
  Serial.println(ssid);
  WiFi.begin(ssid, pass);

  // รอการเชื่อมต่อ WiFi
  while (WiFi.status() != WL_CONNECTED) {
    delay(500);
    Serial.print(".");
  }

  Serial.println("WiFi connected");

  // เชื่อมต่อ MQTT Broker (ฟังก์ชัน connect คืนค่า boolean เพื่อตรวจสอบความสำเร็จ)
  if (client.connect(clientID, mqtt_username, mqtt_password)) {
    Serial.println("Connected to MQTT Broker!");
  } else {
    Serial.println("Connection to MQTT Broker failed...");
  }
}
การส่งข้อมูลใน Main Loop
ในเชิงวิศวกรรม ข้อมูลจากเซนเซอร์มักจะเป็นค่าตัวเลข (Float/Int) แต่โปรโตคอล MQTT รับข้อมูลเป็น String ดังนั้นเราต้องทำการแปลงค่าก่อนส่งด้วย .c_str() และมีการใส่ delay(10) สั้นๆ เพื่อป้องกัน Packet ชนกันในระดับ Network Buffer
connect_MQTT();
delay(10);

if (client.publish(temp_topic, String(bmeData[0]).c_str())) {
  delay(10);
  client.publish(humid_topic, String(bmeData[3]).c_str());
  delay(10);
  client.publish(altitude_topic, String(bmeData[2]).c_str());
  delay(10);
  client.publish(pressure_topic, String(bmeData[1]).c_str());
  delay(10);
  client.publish(distance_topic, String(US100_distance).c_str());
  delay(10);
  Serial.println("Weather data sent!");
} else {
  Serial.println("Weather data failed to send. Retrying in next cycle.");
}

// ปิดการเชื่อมต่อเพื่อประหยัดพลังงาน (Deep Sleep Strategy)
client.disconnect();
WiFi.end();
ส่วนที่ 2: การจัดการข้อมูลบน Server (MQTT & Prometheus Setup)
ข้อมูลที่ส่งมาจาก Arduino จะต้องมี "ตัวรับ" ในที่นี้เราใช้ Raspberry Pi ที่รันระบบปฏิบัติการ Unix-based
- ติดตั้ง Mosquitto: ทำหน้าที่เป็น Broker คอยรับ-ส่ง Message
- ติดตั้ง Prometheus: ระบบฐานข้อมูลแบบ Time-series ที่ออกแบบมาเพื่อเก็บข้อมูล Metric โดยเฉพาะ
การใช้ Python เป็นตัวประสาน (The Bridge)
เราเขียน Python Script เพื่อทำหน้าที่เป็น "ตัวกลาง" รับข้อมูลจาก MQTT แล้วนำไปพักไว้ใน Prometheus Gauge เพื่อให้ Prometheus สามารถดึงข้อมูลไปใช้ต่อได้ และสำรองข้อมูลลง SQLite เพื่อป้องกันข้อมูลสูญหายหากระบบ Cloud มีปัญหา
วิเคราะห์ Code Python:
เราจะสร้าง Gauge เพื่อเก็บค่าสถานะล่าสุดของเซนเซอร์แต่ละตัว
import paho.mqtt.client as mqtt
from prometheus_client import start_http_server, Gauge
import sqlite3
import os

# กำหนดตัวแปร Prometheus Gauge (ชื่อ Metric, คำอธิบาย)
temp = Gauge('temperature', 'Weather Station Temperature')
hum = Gauge('humidity', 'Weather Station Humidity')
alt = Gauge('altitude', 'Weather Station Altitude')
pres = Gauge('pressure', 'Weather Station Pressure')

def on_connect(client, userdata, flags, rc):
    # เมื่อเชื่อมต่อสำเร็จ ให้ทำการ Subscribe หัวข้อที่ต้องการ
    client.subscribe([('outdoor/weather/temperature',1),
                     ('outdoor/weather/humidity',1),
                     ('outdoor/weather/altitude',1),
                     ('outdoor/weather/pressure',1)])

def process_request(msg):
    # ฟังก์ชันประมวลผล Message ที่ได้รับ
    msgStr = str(msg.payload.decode("utf-8")) # แปลง Payload เป็น String

    if msg.topic == 'outdoor/weather/temperature':
        temp.set(msgStr) # ส่งค่าไปยัง Prometheus
        save_to_local_db(msg.topic, msgStr) # เก็บสำรองใน SQLite
    # ... ทำเช่นเดียวกันกับหัวข้ออื่นๆ ...
การเลือกใช้ Gauge เหมาะสมที่สุดสำหรับข้อมูลสภาพอากาศ เพราะเป็นค่าที่ขึ้นลงได้ตลอดเวลา (ต่างจาก Counter ที่มีแต่เพิ่มขึ้น)
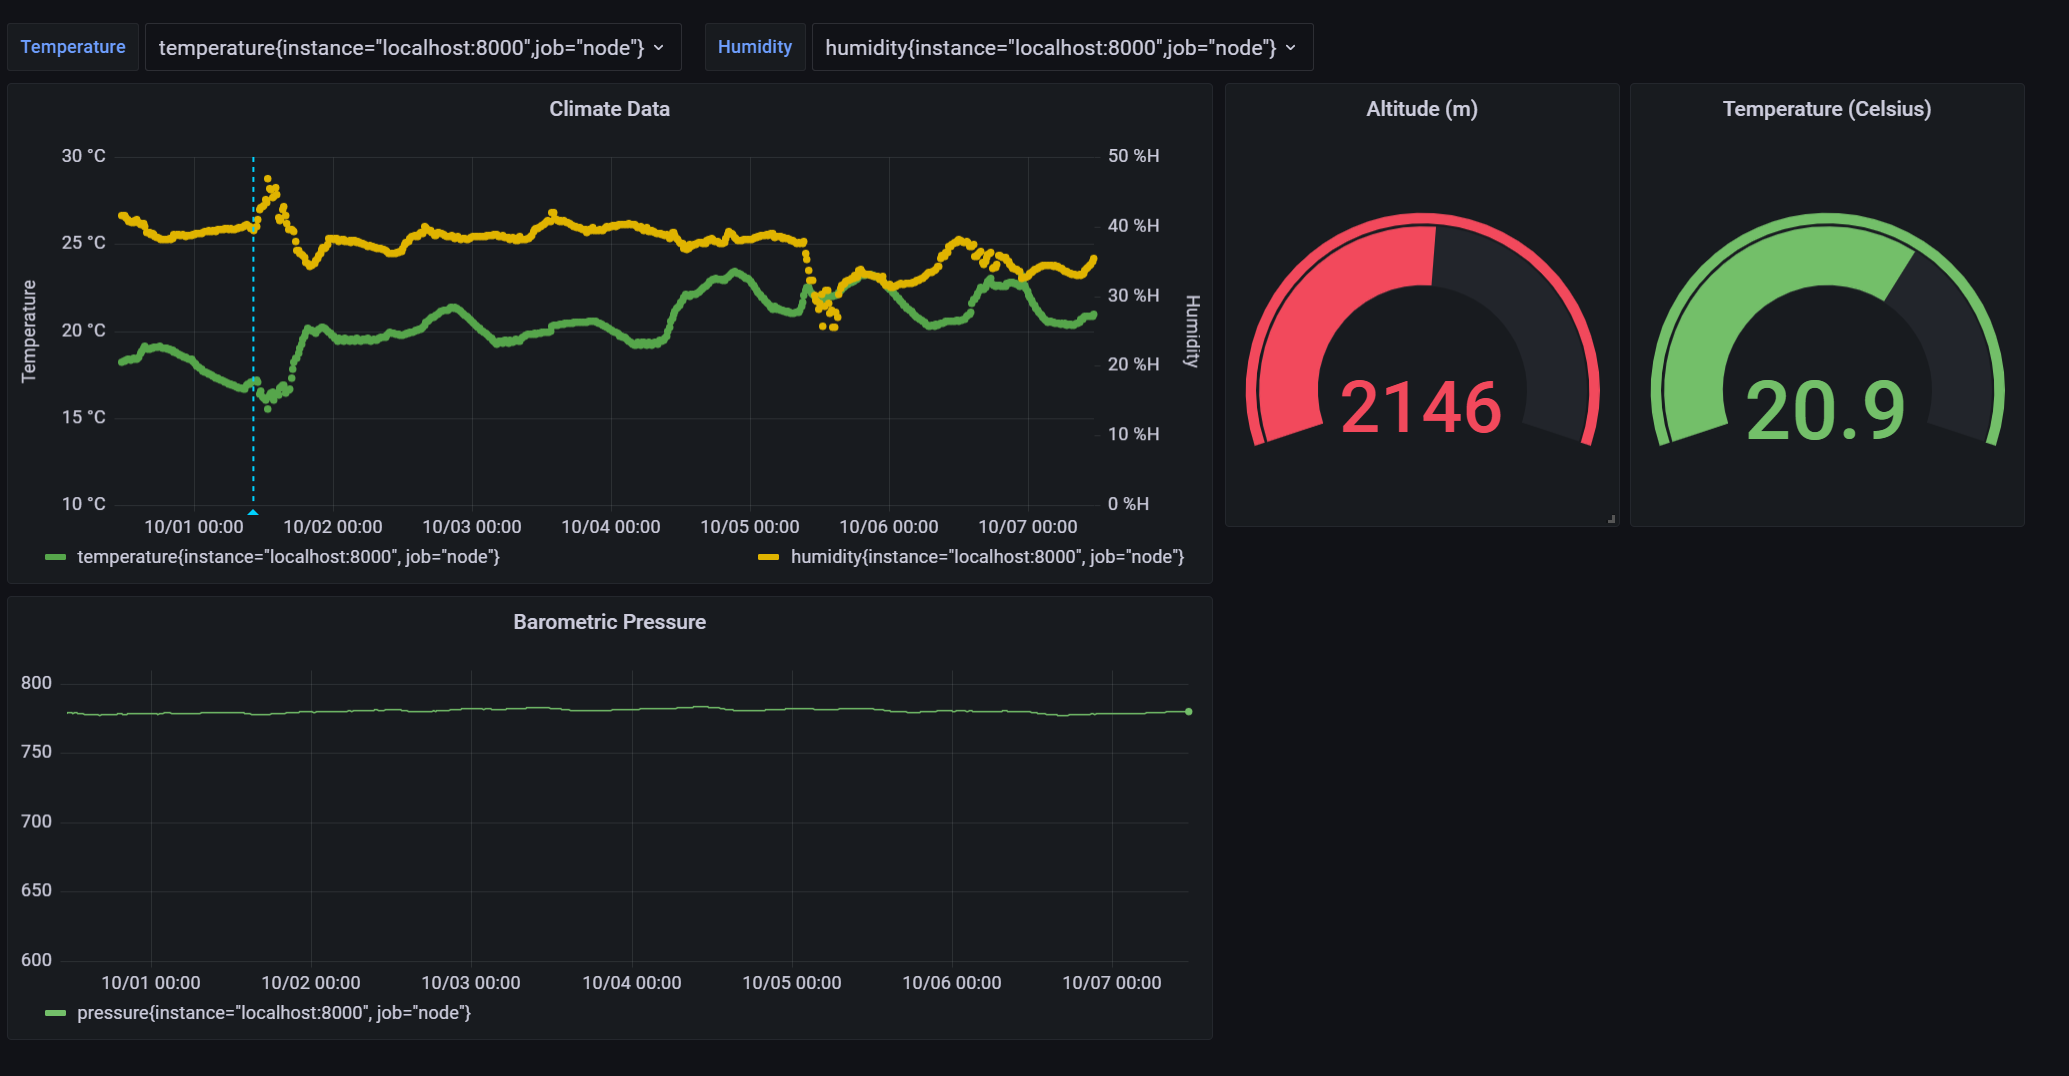
ส่วนที่ 3: การเชื่อมต่อกับ Grafana Cloud และการทำ Visualizing
เมื่อข้อมูลถูกส่งเข้า Prometheus ในเครื่อง Local แล้ว ขั้นตอนสุดท้ายคือการทำให้ข้อมูลนั้นไปโผล่บน Grafana Cloud
- Remote Write: ในไฟล์การตั้งค่า
prometheus.ymlบนเครื่อง Server ของคุณ ต้องเพิ่มคอนฟิกremote_writeพร้อม URL และ Credentials ที่ได้จาก Grafana Cloud account ของคุณ วิธีนี้จะทำให้ Prometheus ในเครื่องส่งข้อมูลขึ้น Cloud โดยอัตโนมัติ - Dashboard Creation: เมื่อข้อมูลเชื่อมถึงกันแล้ว คุณสามารถสร้าง Dashboard โดยเลือก Data Source เป็น Prometheus แล้วเลือก Metric ตามชื่อที่เราตั้งไว้ใน Python (เช่น
temperatureหรือhumidity)
บทสรุป
การเปลี่ยนจากแค่การอ่านค่าเซนเซอร์มาเป็นการทำ Full-stack IoT Monitoring ช่วยให้เราเห็นแนวโน้มของข้อมูล (Trends) และสามารถวิเคราะห์สภาพแวดล้อมได้แม่นยำขึ้น การเลือกใช้โปรโตคอล MQTT ร่วมกับ Prometheus และ Grafana Cloud เป็นแนวทางมาตรฐานอุตสาหกรรมที่ให้ความยืดหยุ่นสูง และรองรับการขยายระบบ (Scalability) ในอนาคตได้เป็นอย่างดี
คุณสามารถดู Source Code ทั้งหมดและตัวอย่างไฟล์คอนฟิกได้ที่ GitHub Repository ของผมครับ!