The project is an evolution of my project "Very low power temp and humidity monitor with min and max". I wanted to extend this to store 24 hours of history and display this in a graph. As explained below, I had to remove the code that put the processor to sleep so I also added a battery level indicator so I know when it needs recharging.
I encountered a couple of issues with extending the project:
- Initially I added an array to store the temperature history
int tempHistory[96];this worked well, however as soon as I added a second array to sore the humidity historyint humidHistory[96]the program would no longer run. It compiled and uploaded but did not even run setup(). Even though it appeared that there was plenty of spare program and variable space, the only conclusion I could come to was that it was running out of memory. Hence, I changed track and am now storing the history in EPROM. - In the linked project I reduced the power consumed to increase battery life by invoking a sleep mode. The issue with this is that it stops the timers being triggered and hence
millis()does not advance during the sleep period. This was an issue as I wanted to store the readings every 15 minutes (96 per day) and there was no way of tracking elapsed time while sleeping. Hence I have removed the code to activate sleep mode. As removing sleep mode will reduce battery life, I added battery monitoring so I know when the battery is getting low. - Finally, I added a screen saver displaying the battery level that is moved every 10 seconds.
The code
The code uses the following libraries:
#include <DHT.h>            // This is the DHT sensor library by Adafruit\t
                            // required for the OLED display \t
#include <SPI.h>            // Synchronous serial data protocol library\t
#include <Wire.h>           // IC2 communications library\t
#include <Adafruit_GFX.h>   // Adafruit Graphics Core Library\t
#include <Adafruit_SSD1306.h>  // SSD1306 library for Monochrome 128x64 and 128x32 OLEDs
#include <EEPROM.h>         // Library to support writing to and reading from EPROM
And these fonts from the Adafruit Graphics Core Library:
#include <Fonts/FreeMonoBold9pt7b.h> \t
#include <Fonts/FreeSans9pt7b.h>
The main areas of interest in the code:
In loop() check to see if screensaver mode needs to be activated or the bitmap moved.
// Check if the time since last display of data started is greater than
 // the time set to keeo the display showing
 if ((millis() - timeDisplay) > keepDisplayFor) {
   // If so in screen save mode
   // Set flag to indicate data not being displayed
   displaying = false;
   // Check if we need to move the bitmap
   if ((millis() - lastMoved) > moveEvery) {
     // Update time last moved
     lastMoved = millis();
     // Dislpay battery bitmap in random position
     DrawScreenSave(random(10, 110), random(10, 45));
   }
 }
We first check if the system has been displaying data for longer than the time set to keep it showing. timeDisplay is the millis() elapsed at the point the button was pressed to activate the display, or to change screens.
if ((millis() - timeDisplay) > keepDisplayFor)...If this time has passed then we make sure the flag is set to indicate that we are not displaying data and check if the time elapsed since we last moved the bitmap exceeds moveEvery, if it has, then we call the routine to display the battery bitmap in a random place each time to avoid burn in.
The system then checks if 2 seconds has elapsed since the last set of readings were taken and, if they have, refreshes the readings and update the minimum and maximum values.
if ((millis() - lastReadingUpdate) > 2000ul) ...If the system is displaying then a switch statement is used to call the routine to present the currently selected data screen, followed by a call to the routine to check if a button has been pressed.
- Mode button (pin 2) activates the display if not currently in display mode. If in display mode then it circulates through the 4 displays using a switch statement.
- Reset button (pin 3) will reset the value of the minimum and maximum readings if data is currently being displayed.
Finally, if 15 minutes have elapsed since the last record in the history data was updated, the system calls the routine to store the current readings in the history.
Checking the battery voltage
We use an Analog Input pin to read the voltage. As we are running from a 3.7v volt battery, we need to adjust the reference voltage used by the pin as otherwise it would be comparing the voltage to itself. The statement analogReference(INTERNAL) sets the pin to compare the input voltage to a regulated 1.1v. We therefore need to reduce the voltage on the input pin to less than 1.1v for this to work. This is done by dividing the voltage using 2 resistors, 1m and 330k ohms. This divides the voltage by approximately 4 so when the battery is fully charged, which is 4.2v, the voltage at the pin input is 4.2/4 = 1.05v.
// Read the monitor pin and calculate the voltage
float BatteryVoltage(){
 float reading = analogRead(MONITOR_PIN);
 // Calculate voltage - reference voltage is 1.1v
 return 1.1 * (reading/1023) * voltageDivider;
}
The function BatterVoltage(), reads the analog pin, which will range from 0 for 0 volts to 1, 023 for 1.1v and using this reading calculates the actual voltage coming form the battery.
The DrawScreenSave() function calls this then selects the appropriate bitmap to display based on the following:
- If voltage is greater then 3.6v - full
- Voltage between 3.5 and 3.6v - 3/4
- Voltage between 3.4 and 3.5v - half
- Voltage between 3.3 and 3.4v - 1/4
- Voltage < 3.3v - empty
Storing the history
As mentioned above, I initially stored the history in arrays but it appears this caused memory issues. I am therefore storing the data in the EPROM in 96 locations for each, temperature and history, in a circular list. The EEPROM library provides the functions to manage data here.
The history is stored as integers which take 2 bytes each on the Arduino. The pointer histPointer for the address of the data ranges from 0 to 95 and then back to 0. tempStart and humidStart store the start locations of each list and each location is simply the start location + the position * 2.
Displaying the graphs
The graph routines first obtain the minimum and maximum values in the history, calculate the scale and then plot the graph using line draw from the oldest value (histPointer + 1) to the latest stored at histPointer.
On/Off switch
If you wish to add an on/off switch insert this in the wire from the charger module OUT+ to the Arduino board. This will allow you to charge the battery with the unit switched off.
Regulating the battery charging
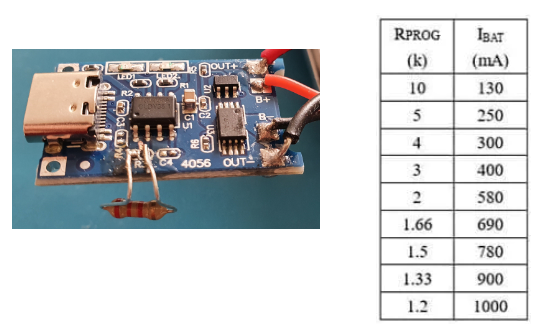
The TP4056 charger used includes a regulating resistor of 1.1K ohm that provides a charge at a rate of 1, 000mAh. This is really too high for the 1, 000mAh battery used which should be charged at a maximum of 500mAh. It is fiddly, but you can remove the board mounted resistor (R3), or I find it easier to break it by scraping a knife across it as this leaves the post to solder to, and solder on an external resistor to reduce the current. Here is the table showing resistor values and current produced. (Check with a meter that you are still reading the correct resistance across the connection as it is easy to short these and this could cause damage.)
🛠️ เจาะลึกเบื้องหลังการทำงาน (Deep Dive / Technical Analysis)
While a simple LCD outputs text, the TFT Graphing Monitor takes datalogging to the next level. This project involves storing historical sensor data in an array and actively drawing a line chart on a color display to visualize trends.
Array History Math
To draw a graph that sweeps from left to right:
- The Array: You create an array with a size matching the pixel width of your screen (e.g.,
int tempHistory[320]). - The Shift: Every minute, you read the DHT22 sensor. Before saving it, you use a
forloop to shift every existing data point in the array one slot to the left, deleting the oldest reading at slot 0. - The Current Data: You save the new temperature into the final slot of the array.
The Draw Loop
In the display routine, you loop through the array. Using the tft.drawLine() function, you connect point 0 to point 1, point 1 to point 2, and so on. You must use the map() function to convert the temperature (20°C to 40°C) to the screen's Y-pixel coordinates (e.g., 200 pixels down to 10 pixels), flipping the axis so higher temperatures draw higher on the screen!
Components Needed
- Arduino Mega or ESP32: High RAM is required to hold large history arrays.
- 2.8" or 3.5" TFT Touchscreen Shield: The canvas.
- DHT22 / BME280 Sensor: The climate probe.
- Lithium-Ion Battery + Protection Circuit: For portability.
This is a fantastic introduction to Data Visualization on microcontrollers.