โปรเจคนี้จะแสดงให้เห็นว่า การทำแผงแสดงผลง่ายๆ (สำหรับเทอร์โมสตัท) น่ะมันง่ายโคตรๆ แค่เชื่อมต่อจออัจฉริยะ Matrix Orbital GTT Intelligent TFT HMI เข้ากับ Arduino Nano ผ่าน I2C เท่านั้นเอง เราใช้เซ็นเซอร์วัดอุณหภูมิและความชื้น DHT22 ในการดึงข้อมูล จากนั้น Arduino Nano ก็จะประมวลผลข้อมูลเพื่อแสดงกราฟย้อนหลังรายชั่วโมง, 24 ชั่วโมง และรายสัปดาห์ รวมถึงมีกราฟสดให้ดูค่าปัจจุบันด้วย
ถ้าเราเพิ่มระบบไฟฟ้าหรือระบบไฟฟ้า-กลไกเข้าไปด้านหลังแผงแสดงผลนี้ล่ะก็ มันก็จะกลายเป็นเทอร์โมสตัทสุดเท่ที่มีจอ TFT สีสันสดใสเลยล่ะ
ภาพรวมโปรเจค
"Temp-Humid-Logger" นี่คือการนำ Asynchronous Hygrometric-Forensics และ I2C-Temporal HMI Orchestration มาทำกันแบบจริงจังเลยทีเดียว ออกแบบมาให้เป็นโหนดตรวจวัดสภาพแวดล้อมระดับอุตสาหกรรม ใช้จออัจฉริยะตระกูล GTT จาก Matrix Orbital ในการแสดงผลสถาปัตยกรรมข้อมูลที่ซับซ้อนผ่านการเชื่อมต่อแบบ I2C โปรเจคนี้จะพาไปสำรวจการแมปสตรีมบิตจากเซ็นเซอร์ให้กลายเป็นกริดข้อมูลรายชั่วโมง, รายสัปดาห์ และรายเดือน โดยใช้ Statistical-Accumulation Heuristic ในการจัดการกราฟที่มีจุดข้อมูลมากกว่า 180 จุดแบบเรียลไทม์ โฟกัสที่การวินิจฉัยการสื่อสาร HMI แบบไฮไฟเดลิตี้, การตรวจสอบความสมบูรณ์ของ resistive-pullup และความเสถียรทางความร้อนในระยะยาว
ขั้นตอนที่ 1: ออกแบบส่วนติดต่อผู้ใช้ (UI)
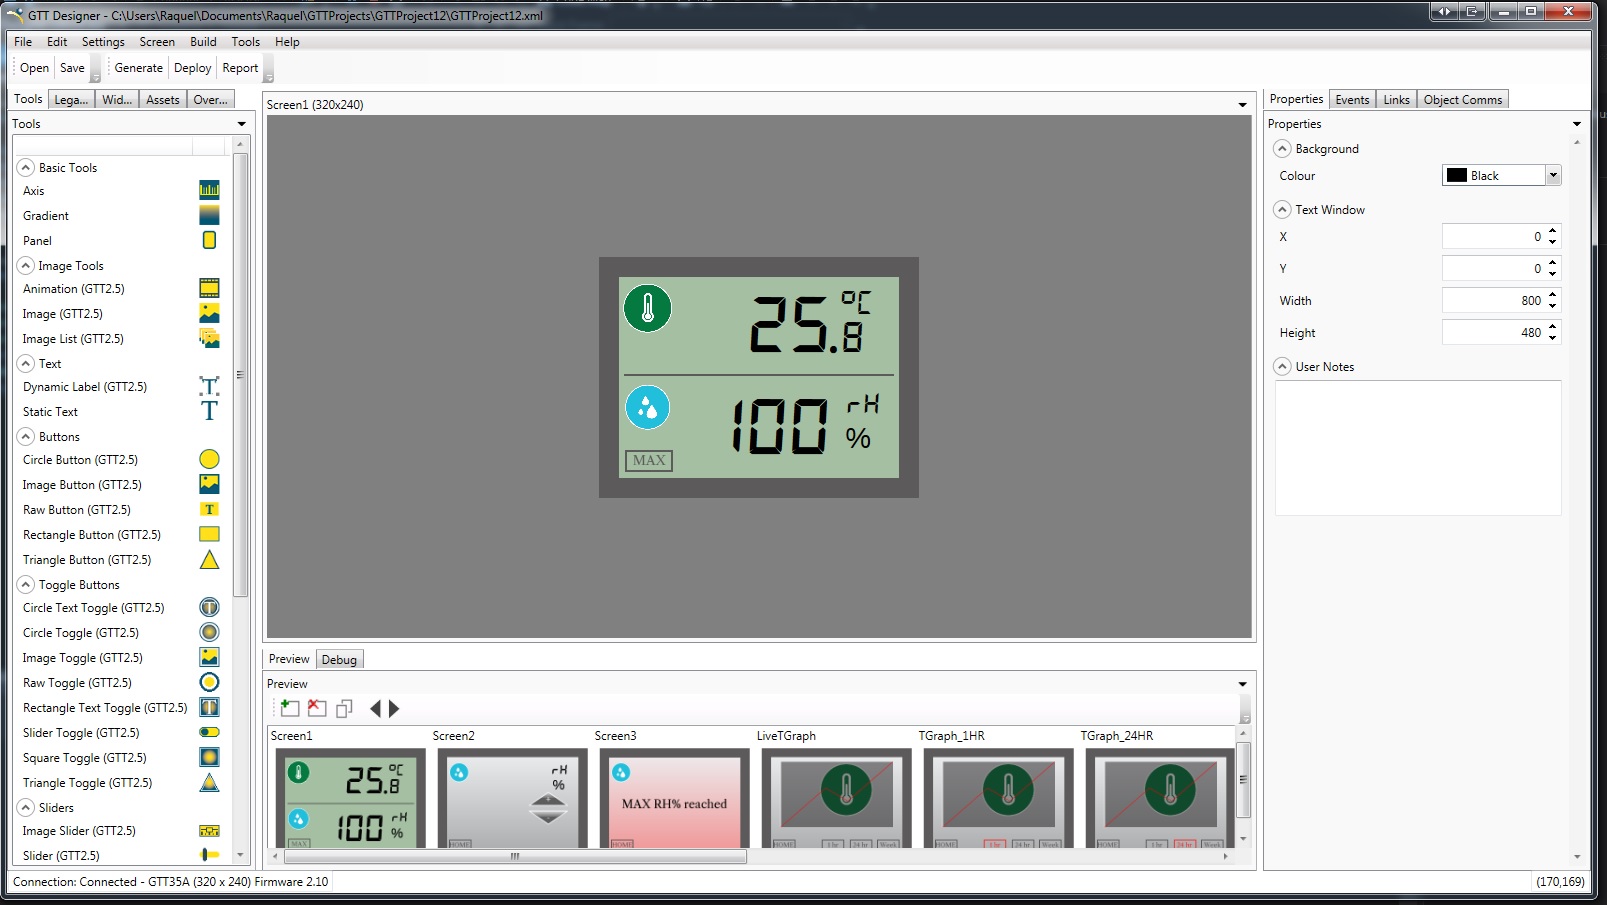
GTT Designer Suite ช่วยให้เราลากวางวิดเจ็ตต่างๆ ลงบนหน้าจอได้ง่ายๆ สามารถนำเข้าไฟล์รูปภาพและฟอนต์มาใช้สร้าง GUI ได้ด้วย สำหรับโปรเจคนี้ เราสร้างหลายหน้าจอ ซึ่งจะถูกประมวลผลเป็นสคริปต์อัตโนมัติเมื่อกดปุ่มต่างๆ
สำหรับหน้าจอแรก (HOME) เราได้ลากวาง:
- ป้ายข้อความ (label) (ป้ายบน: แสดงข้อมูลอุณหภูมิเป็น °C; ป้ายล่าง: แสดงข้อมูลความชื้นเป็น % rh)
- ปุ่ม (ปุ่มล่องหนที่ซ่อนอยู่บนป้ายข้อความ ซึ่งจะเปิดกราฟสดของอุณหภูมิหรือความชื้น และปุ่ม 'MAX' สำหรับตั้งค่าการแจ้งเตือนความชื้นสูงสุด)
หน้าจอที่ 2 คือหน้าตั้งค่าการแจ้งเตือนความชื้นสูงสุด (MAX) เริ่มต้น เราใช้วิดเจ็ต:
- ปุ่มสามเหลี่ยมสองปุ่ม (ขึ้นและลง) ใช้สำหรับปรับตั้งค่าความชื้นสูงสุด ค่าเริ่มต้นจะแสดงไว้ (ตั้งไว้ที่ 70%) และปุ่มสามเหลี่ยมนี้จะส่งรายงานไปยัง Arduino เพื่อให้ Arduino ประมวลผลเพื่อเพิ่มหรือลดค่าการตั้งค่า
- ปุ่ม ('HOME' ที่จะพากลับไปยังหน้าจอแรก)
หน้าจอที่ 3 คือหน้าจอแจ้งเตือน (ALERT) เมื่อความชื้นถึงค่าสูงสุดที่ตั้งไว้ Arduino จะยังคงตรวจสอบข้อมูลความชื้นต่อไป และจะพากลับไปที่หน้าจอ HOME เมื่อระดับความชื้นต่ำกว่าค่าที่ตั้งไว้
หน้าจอต่อไปนี้: LiveTGraph, TGraph_1HR, TGraph_24HR, TGraph_1WK คือกราฟย้อนหลังของข้อมูลอุณหภูมิ ส่วน LiveHGraph, HGraph_1HR, HGraph_24HR, HGraph_1WK คือกราฟย้อนหลังของข้อมูลความชื้น เราใช้วิดเจ็ต:
- กราฟ (กราฟสดมี 30 จุดข้อมูล, ส่วนกราฟย้อนหลัง: 1 ชม., 24 ชม. และ 1 สัปดาห์ มี 180 จุด)
- ปุ่ม (ปุ่ม 1 ชั่วโมง, 24 ชั่วโมง และ 1 สัปดาห์ สำหรับเปิดกราฟแต่ละแบบ)
เมื่อออกแบบเสร็จแล้ว ก็สามารถดีพลอยโปรเจคไปยังจอ GTT ได้เลย แค่เชื่อมต่อพีซีของคุณเข้ากับหัวต่อ Mass Storage ของ GTT แล้วกด "Deploy" ใน GTT Designer ไฟล์ที่จำเป็นทั้งหมดจะถูกสร้างและส่งตรงไปยังจอแสดงผล
ขั้นตอนที่ 2: ต่อ GTT เข้าไป
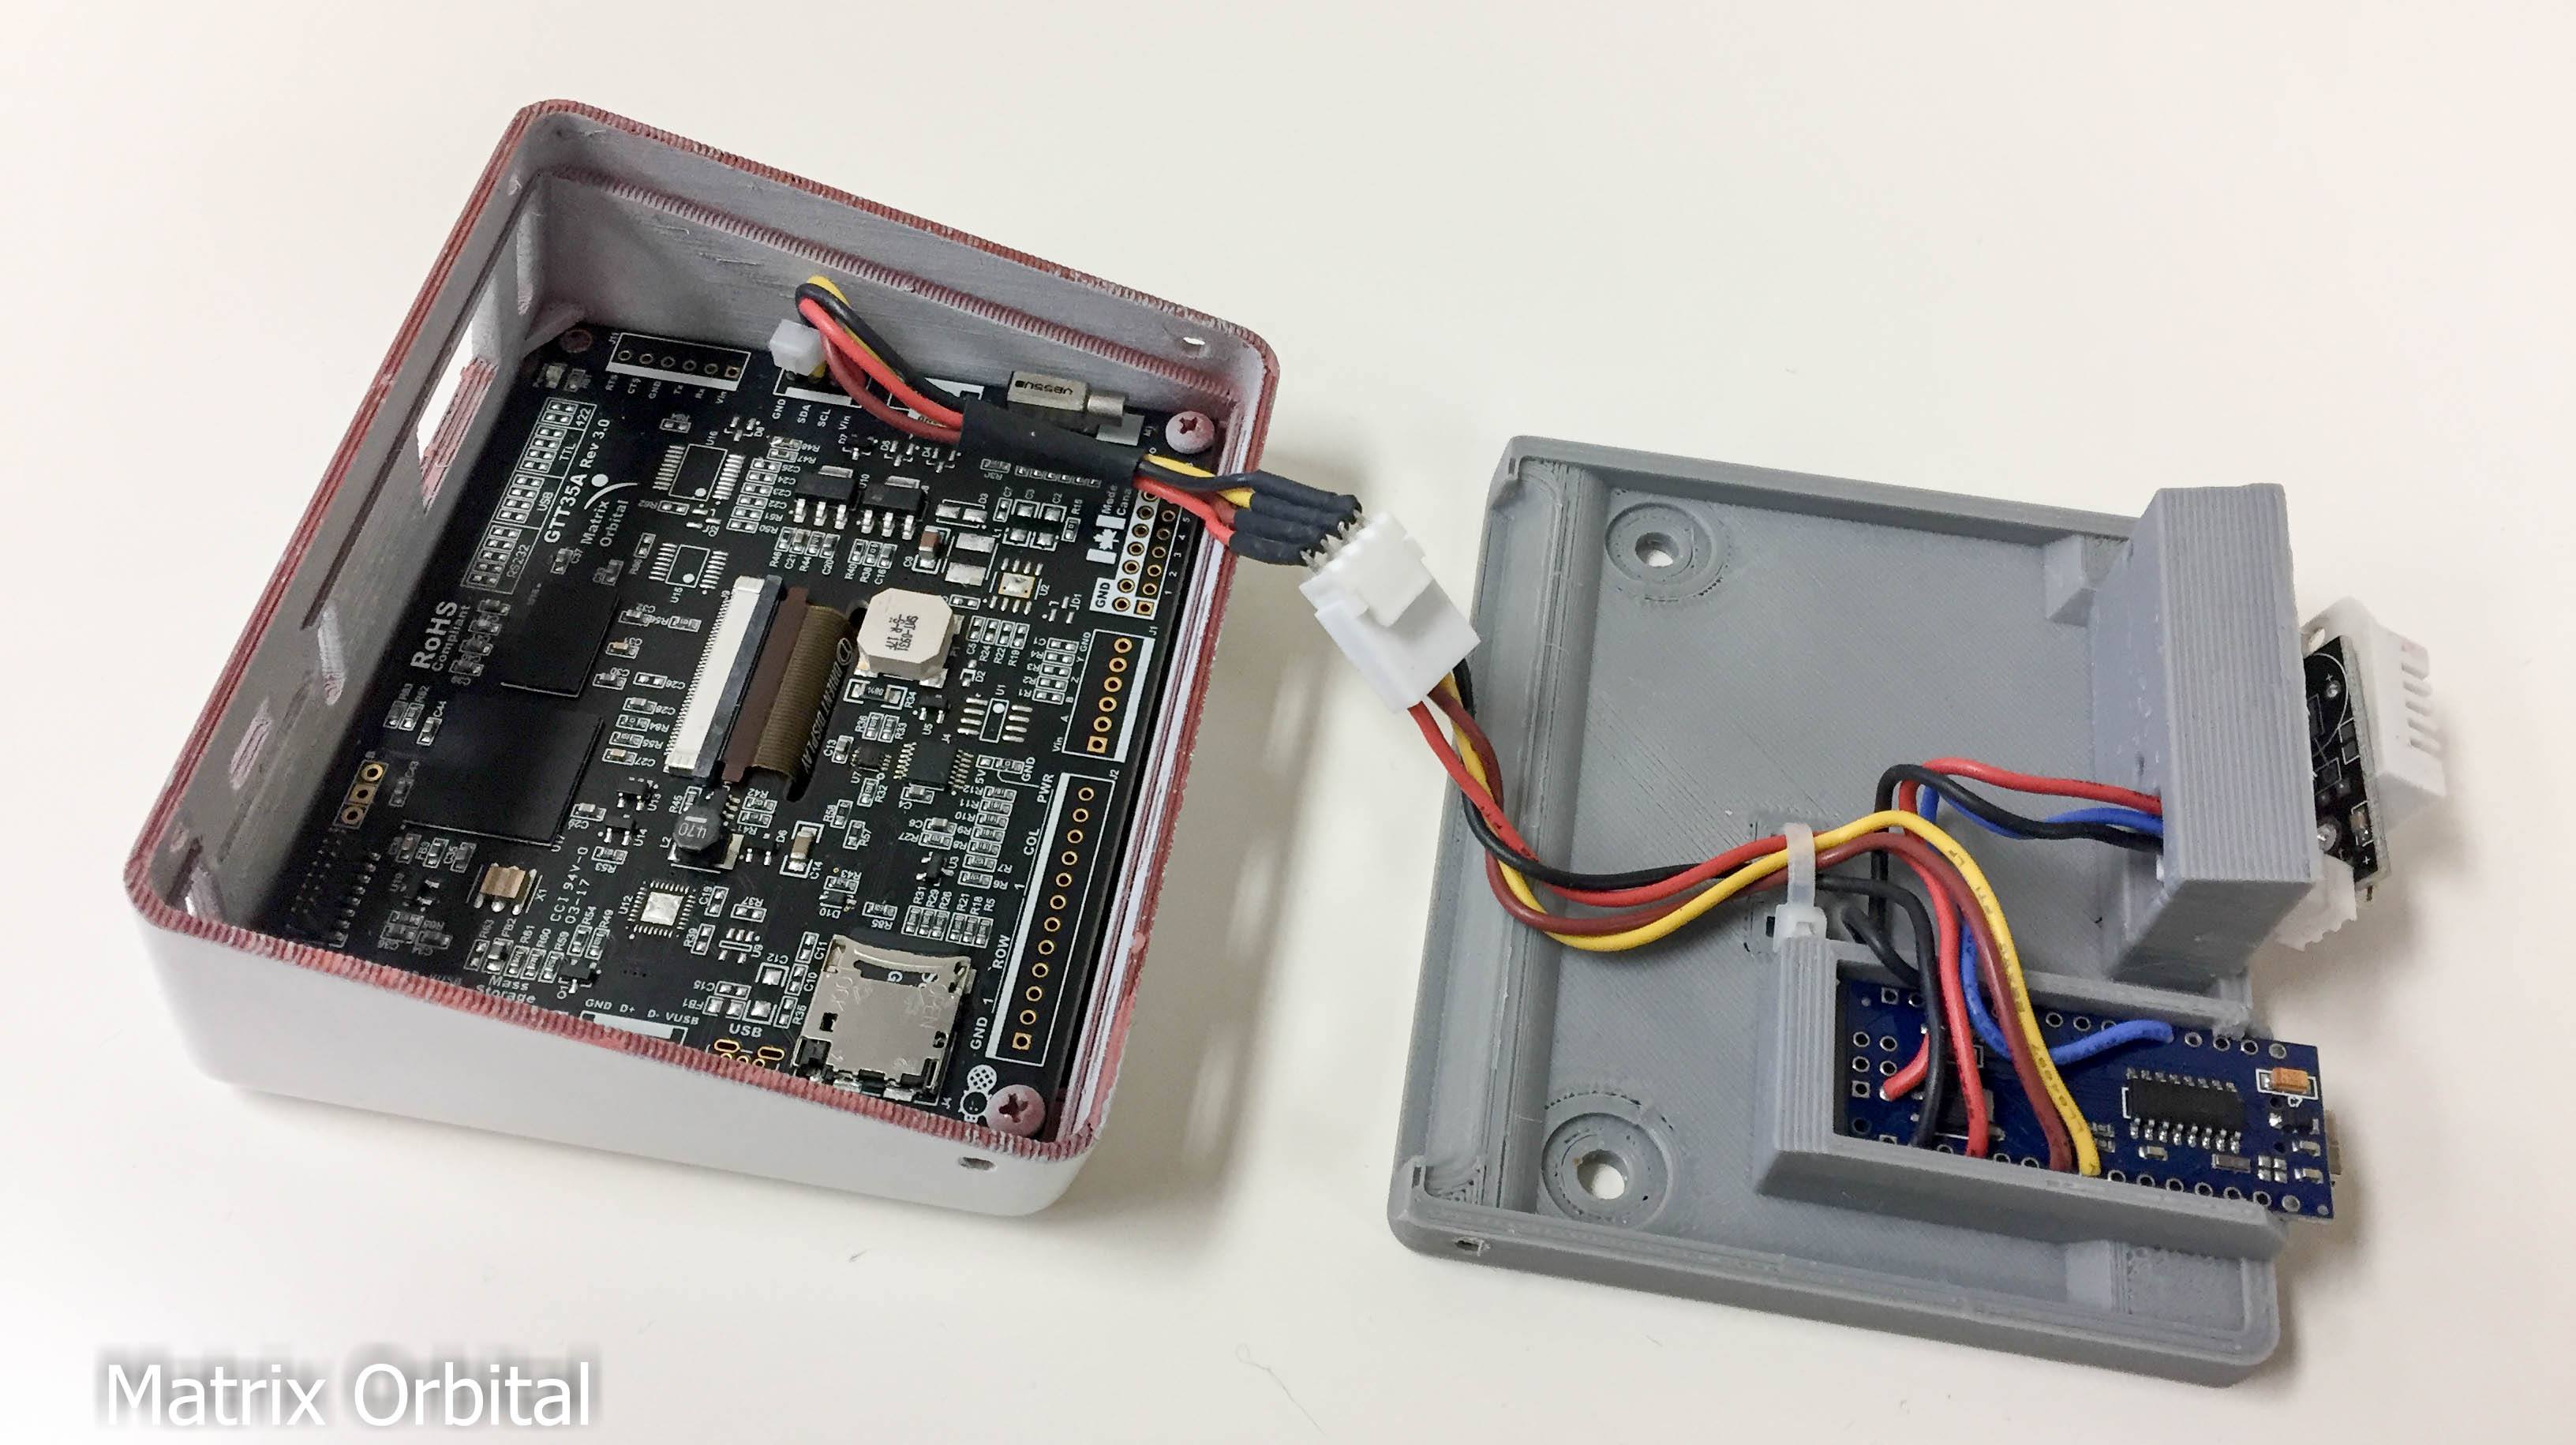
สำหรับงานนี้ เราจะใช้ I2C ในการคุยกันระหว่าง Arduino Uno กับ GTT ใช้สายบรัดบอร์ดต่อเฮดเดอร์ 4 พินเข้ากับพอร์ต I2C ของ GTT จากนั้นต่อสายสีแดง (ไฟเลี้ยง 5V) และสายสีดำ (กราวด์) ให้เรียบร้อย สายสีเหลือง (SDA) และสีเขียว (SCL) ให้ต่อเข้ากับขา SDA (A4) และ SCL (A5) ของ Arduino Nano ตามลำดับ ไม่ต้องใช้ตัวต้านทานดึงขึ้น (Pull-up Resistor) กับ GTT นะ เพราะไลบรารี Wire ของ Arduino เปิดตัวดึงขึ้นภายในให้อัตโนมัติอยู่แล้ว ถ้าอยากจ่ายไฟเพิ่มก็เสียบผ่านเบอร์เรลแจ็กของจอได้เลย
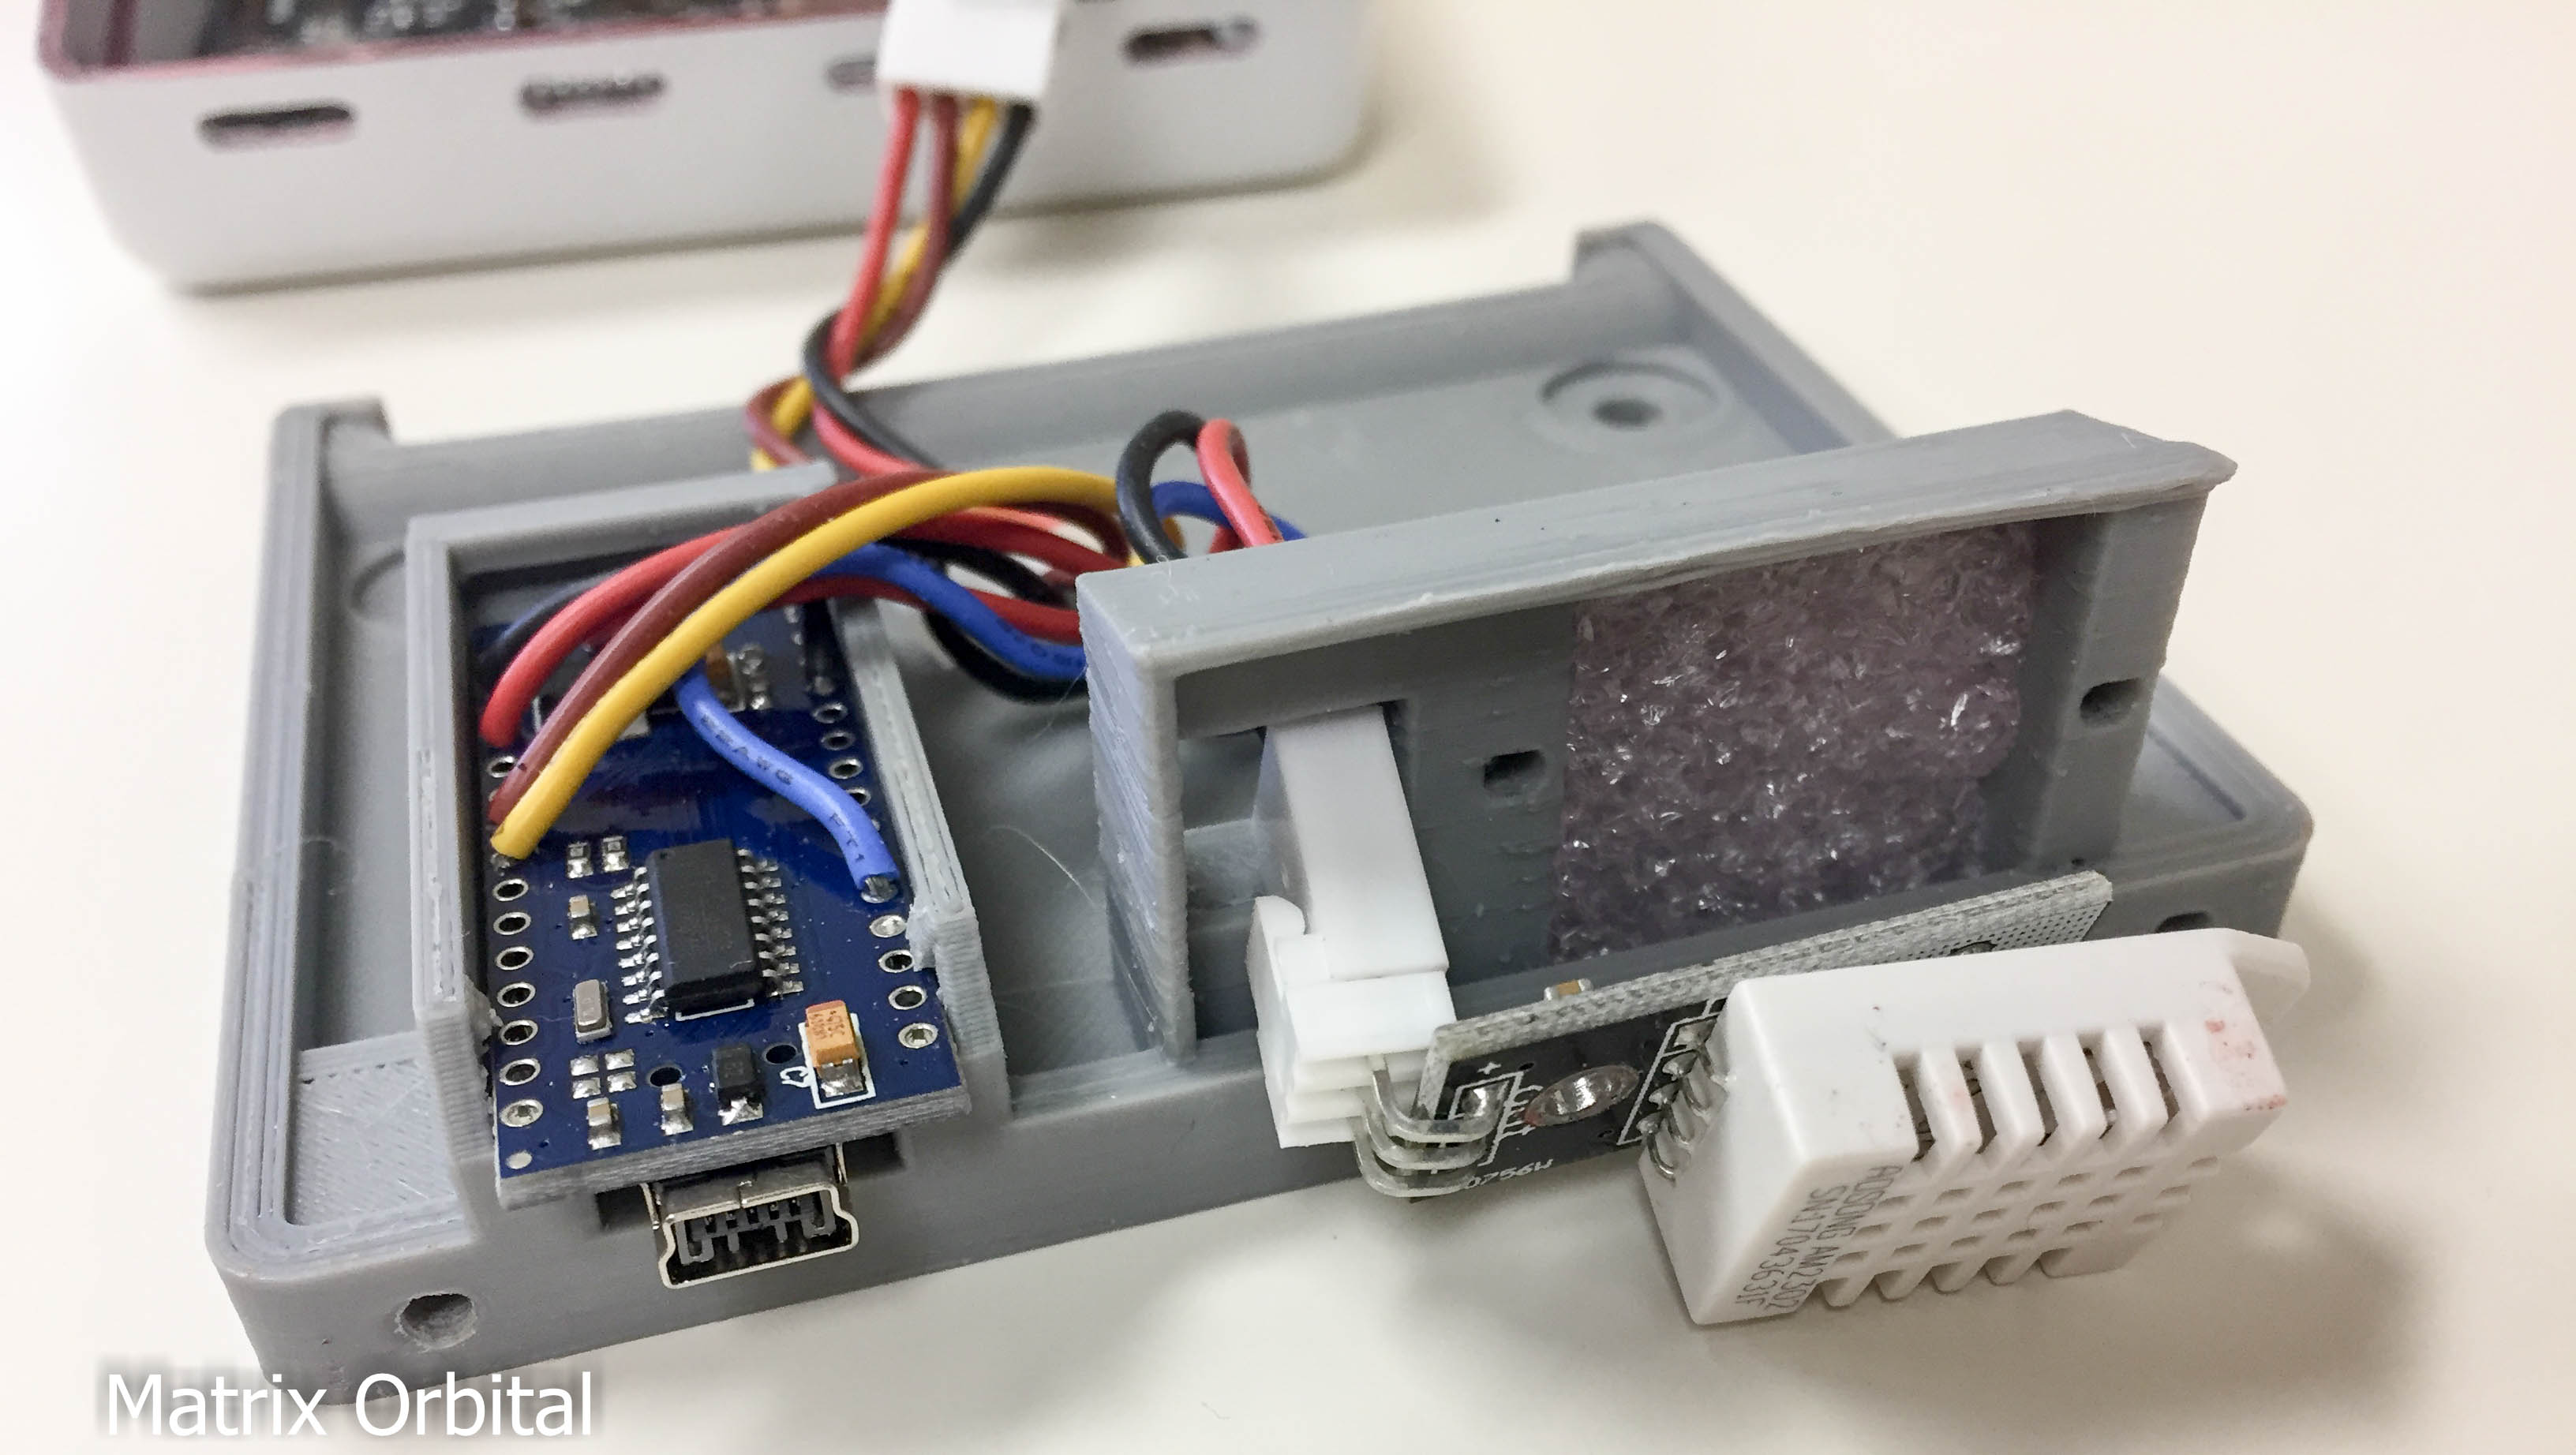
ขั้นตอนที่ 3: ต่อ DHT22
ห้ามลืม! ต้องต่อตัวต้านทาน (Resistor) 4.7k โอห์มดึงขึ้น (Pull-up) ระหว่างขาข้อมูลของ DHT22 กับไฟ +5V ด้วย ไม่งั้นเซนเซอร์จะคุยกับเราไม่รู้เรื่อง ขาข้อมูลของ DHT22 ต่อเข้ากับขาดิจิทัลไหนของ Arduino ก็ได้ ในตัวอย่างนี้เราเลือกใช้ขา 8
ขั้นตอนที่ 4: ติดตั้งไลบรารี
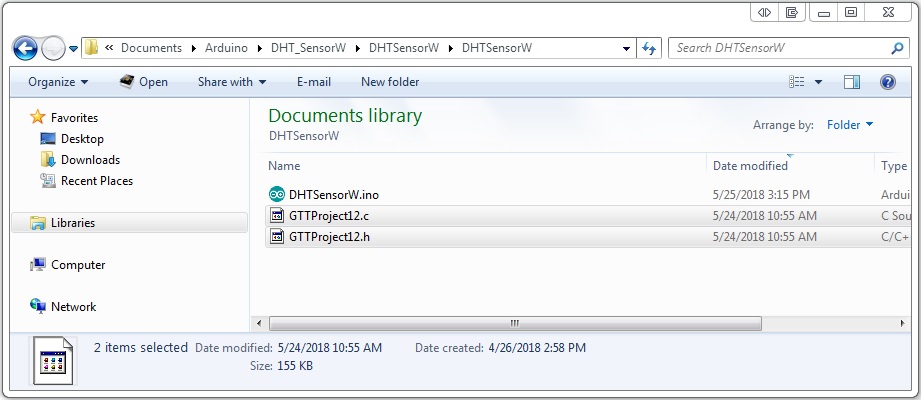
ก่อนจะไปต่อ ดาวน์โหลดและแตกไฟล์ไลบรารีสำหรับ GTT Client นี้ซะ ไลบรารีพวกนี้ก็หาได้ในไฟร์แวร์ล่าสุดของ GTT นั่นแหละ พอดาวน์โหลดมาแล้ว ให้คัดลอกเนื้อหาในโฟลเดอร์ GttClient ไปไว้ที่ \\Users\\ชื่อUserของนาย\\Documents\\Arduino\\libraries\\gtt ให้เรียบร้อย
ล้วงลึกเทคนิค (Technical Deep-Dive)
- การจัดการข้อมูลความชื้นและนิติวิทยาศาสตร์ I2C:
- โพรบเก็บข้อมูล DHT22: ใช้เซนเซอร์วัดความชื้นแบบ capacitive กับเทอร์มิสเตอร์วัดอุณหภูมิ กระบวนการตรวจสอบเกี่ยวข้องกับการวัด "ช่วงเวลาสัญญาณบนบัสเดียว (Single-Bus Signal-Timing)" เซนเซอร์จะส่งแพ็กเก็ตข้อมูล 40 บิต $(16\text{ bit ความชื้น, } 16\text{ bit อุณหภูมิ, } 8\text{ bit เช็คซัม})$ การวินิจฉัยจะโฟกัสที่ "การวิเคราะห์ความถูกต้องของเช็คซัม (Checksum-Fidelity Analytics)" เพื่อให้แน่ใจว่าจับการเปลี่ยนแปลงของสิ่งแวดล้อมได้โดยไม่เกิดข้อผิดพลาด
- ฮับกำหนดเวลาของ I2C: ทำงานที่ความถี่นาฬิกา $100\text{kHz}$ ที่กำหนดไว้ การตรวจสอบรวมถึงการวัด "ความหน่วงเวลาของการแลกเปลี่ยนแพ็กเก็ต (Packet-Transaction Latency)" ระหว่าง Nano กับ GTT35A การวินิจฉัยใช้รูทีน
i2cWriteแบบกำหนดเอง โดยจำกัดขนาดข้อมูลที่ 32 ไบต์ เพื่อป้องกันไม่ให้บัสค้าง (bus-hang) บนบัฟเฟอร์ Wire ภายในของ Arduino
- การสร้างภาพกราฟิกและสถิติสำหรับวินิจฉัย:
- การวิเคราะห์จอแสดงผลอัจฉริยะ GTT: ใช้สคริปต์เอนจินแบบกำหนดเองเพื่อวาดกราฟความละเอียดสูง การตรวจสอบรวมถึงการคำนวณ "ค่าเฉลี่ยเคลื่อนที่ (Rolling-Average Harmonics)" โดยสะสมค่าเฉลี่ยจาก 10 ตัวอย่าง $(ช่วงเวลา 20\text{ วินาที})$ เพื่อเติมข้อมูลลงในกริดเทเลเมทรีสำหรับ 1 ชั่วโมง, 24 ชั่วโมง และ 1 สัปดาห์
- การตรวจสอบความคงทนของหน่วยความจำแฟลช: ใช้การ์ด uSD ในการเก็บชุดข้อมูลเทเลเมทรี
.datการวินิจฉัยจะโฟกัสที่ "ความสมบูรณ์ของระบบไฟล์ (File-System Integrity)" ทำให้สามารถกู้สถานะและโหลดข้อมูลเทเลเมทรีย้อนหลังได้หลังจากเปิด-ปิดเครื่อง
ขั้นตอนที่ 5: เขียนโค้ด
//GTT Arduino Tempearature and Humidity Demo
//Arduino Uno with Matrix Orbital GTT35A and DHT22
//Created by R Malinis, 25/05/2018
//support@matrixorbital.ca
//www.matrixorbital.ca/appnotes
#include <Dhcp.h>
#include <Dns.h>
#include <Ethernet.h>
#include <EthernetClient.h>
#include <EthernetServer.h>
#include <EthernetUdp.h>
#include <gtt.h>
#include <gtt_device.h>
#include <gtt_enum.h>
#include <gtt_events.h>
#include <gtt_ext_types.h>
#include <gtt_packet_builder.h>
#include <gtt_parser.h>
#include <gtt_protocol.h>
#include <gtt_text.h>
#include <Wire.h>
#include <SimpleDHT.h>
#include "GTTProject12.c"
#include "GTTProject12.h"
#include <stdlib.h>
#define I2C_Address 0x28 //Define default 8bit I2C address of 0x50 >> 1 for 7bit Arduino
// Buffer for incoming data
uint8_t rx_buffer[128];
// Buffer for outgoing data
uint8_t tx_buffer[256];
gtt_device gtt; //Declare the GTT device
typedef enum
{
NOGraph =0,
TempGraph=1,
HumiGraph=2
} GraphScreen;
// DHT11
int pinDHT22 = 8;
SimpleDHT22 dht22;
byte defaultMaxHumidity;
bool MaxHumidityScreen = false;
GraphScreen Graph = NOGraph;
typedef struct
{
byte ChartData;
byte ChartObject;
float rawData;
}DataSourceType;
DataSourceType Temperature;
DataSourceType Humidity;
void LiveGraph(float temperature, float humidity)
{
if (Graph == NOGraph)
return;
DataSourceType source;
if (Graph == TempGraph)
{
source = Temperature;
source.rawData = temperature;
source.ChartData = id_livetgraph_t_live_data0;
source.ChartObject = id_livetgraph_t_live_;
}
else
{
source = Humidity;
source.rawData = humidity;
source.ChartData = id_livehgraph_h_live_data0;
source.ChartObject = id_livehgraph_h_live_;
}
gtt25_dataset_push_data(>t, source.ChartData, (float) source.rawData);
gtt25_visualobject_invalidate(>t, source.ChartObject);
Serial.println("drawing LIVE graph");
return;
}
void GTT25ButtonHandler(gtt_device* device, uint16_t ObjectID, uint8_t State)
{
Serial.print("button handler: ");
Serial.print(ObjectID);
Serial.print(" state: ");
Serial.println(State);
if (State != 1)
return;
MaxHumidityScreen = false;
Graph = NOGraph;
switch (ObjectID)
{
case id_screen2_triangle_button_1:
defaultMaxHumidity++;
break;
case id_screen2_triangle_button_2:
defaultMaxHumidity--;
break;
case id_screen1_max_btn:
break;
case id_screen1_image_button_1:
Graph = TempGraph;
return;
break;
case id_screen1_image_button_2:
Graph = HumiGraph;
return;
break;
// the following buttons take care of themselves as designed in the GTT Designer
// only used here for serial debug
case id_screen2_home_btn:
case id_screen3_home_btn:
case id_livehgraph_home_btn:
case id_hgraph_1hr_home_btn:
case id_hgraph_24hr_home_btn:
case id_hgraph_1wk_home_btn:
case id_livetgraph_home_btn:
Serial.println("==== back to HOME screen");
return;
break;
case id_livetgraph_1_hr_btn:
case id_tgraph_1hr_1_hr_btn:
case id_tgraph_24hr_1_hr_btn:
case id_tgraph_1wk_1_hr_btn:
case id_livehgraph_1_hr_btn:
case id_hgraph_1hr_1_hr_btn:
case id_hgraph_24hr_1_hr_btn:
case id_hgraph_1wk_1_hr_btn:
Serial.println("==== displaying 1 HOUR");
return;
break;
case id_livetgraph_24_hr_btn:
case id_tgraph_1hr_24_hr_btn:
case id_tgraph_24hr_24_hr_btn:
case id_tgraph_1wk_24_hr_btn:
case id_livehgraph_24_hr_btn:
case id_hgraph_1hr_24_hr_btn:
case id_hgraph_24hr_24_hr_btn:
case id_hgraph_1wk_24_hr_btn:
Serial.println("==== displaying 24 HOUR");
return;
break;
case id_livetgraph_1_wk_btn:
case id_tgraph_1hr_1_wk_btn:
case id_tgraph_24hr_1_wk_btn:
case id_tgraph_1wk_1_wk_btn:
case id_livehgraph_week_btn:
case id_hgraph_1hr_week_btn:
case id_hgraph_24hr_week_btn:
case id_hgraph_1wk_week_btn:
Serial.println("==== displaying 1 WEEK");
return;
break;
}
char buf[] = {0};
int16_t humid = defaultMaxHumidity;
sprintf(buf, "%d", humid); //แปลงค่าความชื้นเป็นสตริง
gtt_set_screen2_humi_label_1_text(>t, gtt_make_text_ascii(buf)); //อัพเดทป้ายบน GTT
Serial.println("defaultMaxHumidity is set");
Serial.println(humid);
}
void HumidityCheck(float humidityVal)
{
if (humidityVal > defaultMaxHumidity)
{
Serial.print("max: "); Serial.print((int)defaultMaxHumidity);
Serial.print(" current:"); Serial.println((int)humidityVal);
if (MaxHumidityScreen == false)
{
gtt_run_script(>t, (char*)("GTTProject12\\\\Screen3\\\\Screen3.bin"));
MaxHumidityScreen = true;
delay(2000);
}
}
if (MaxHumidityScreen == true && (humidityVal < defaultMaxHumidity))
{
gtt_clear_alltraces(>t);
gtt_run_script(>t, (char*)("GTTProject12\\\\Screen1\\\\Screen1.bin"));
MaxHumidityScreen = false;
delay(2000);
}
return;
}
float TempData[10] = {0,0,0,0,0,0,0,0,0,0};
float HumiData[10] = {0,0,0,0,0,0,0,0,0,0};
bool OldDataLoaded = false;
void UpdateDataCollection(float temperature, float humidity)
{
float avgTempData, avgHumiData;
static byte counter20sec = 0; // 180 จุดข้อมูล = 1 ชม.
static byte counter8mins = 0; // 180 จุดข้อมูล = 24 ชม.
static byte counter56mins = 0;// 180 จุดข้อมูล = 1 สัปดาห์
DataSourceType dataSource;
static byte HrMaxH = 15;
static byte HrMinH = 25;
static byte HrMaxT = 20;
static byte HrMinT = 25;
static byte T24HrMaxH = 15;
static byte T24HrMinH = 25;
static byte T24HrMaxT = 20;
static byte T24HrMinT = 25;
//debug
static byte count20secP = 0;
static byte count8minP = 0;
static byte count56minP = 0;
LiveGraph(temperature, humidity);
//Serial.print("Data (not collected): ");
//Serial.print((float)temperature); Serial.print(" *C, ");
//Serial.print((float)humidity); Serial.println(" RH%");
eStatusCode r;
if (OldDataLoaded == false)
{
OldDataLoaded = true;
r = gtt25_dataset_load(>t, id_tgraph_24hr_24_hr_chart_data0, gtt_make_text_ascii("Temp24hrMax.dat"));
r = gtt25_dataset_load(>t, id_tgraph_24hr_24_hr_chart_data1, gtt_make_text_ascii("Temp24hrMin.dat"));
r = gtt25_dataset_load(>t, id_hgraph_24hr_24_hr_chart_data0, gtt_make_text_ascii("Humidity24hrMax.dat"));
r = gtt25_dataset_load(>t, id_hgraph_24hr_24_hr_chart_data1, gtt_make_text_ascii("Humidity24hrMin.dat"));
r = gtt25_dataset_load(>t, id_tgraph_1wk_1_wk_chart_data0, gtt_make_text_ascii("Temp1WkMax.dat"));
r = gtt25_dataset_load(>t, id_tgraph_1wk_1_wk_chart_data1, gtt_make_text_ascii("Temp1WkMin.dat"));
r = gtt25_dataset_load(>t, id_hgraph_1wk_1_wk_chart_data0, gtt_make_text_ascii("Humidity1WkMax.dat"));
r = gtt25_dataset_load(>t, id_hgraph_1wk_1_wk_chart_data1, gtt_make_text_ascii("Humidity1WkMin.dat"));
if (r != eStatusCode_Success)
{
Serial.println("Check uSD card");
}
}
// รวบรวมข้อมูลเพื่อหาค่าเฉลี่ยทุก 20 วินาที (10 การอ่านค่า)
TempData[counter20sec] = temperature;
HumiData[counter20sec] = humidity;
//Serial.print("temp: ");
//Serial.print(temperature);
//Serial.print(" humidity: ");